Subsaharan African vs Immigrants 12th Grade, No Diploma
COMPARE
Subsaharan African
Immigrants
12th Grade, No Diploma
12th Grade, No Diploma Comparison
Sub-Saharan Africans
Immigrants
90.1%
12TH GRADE, NO DIPLOMA
1.9/ 100
METRIC RATING
239th/ 347
METRIC RANK
88.2%
12TH GRADE, NO DIPLOMA
0.0/ 100
METRIC RATING
295th/ 347
METRIC RANK
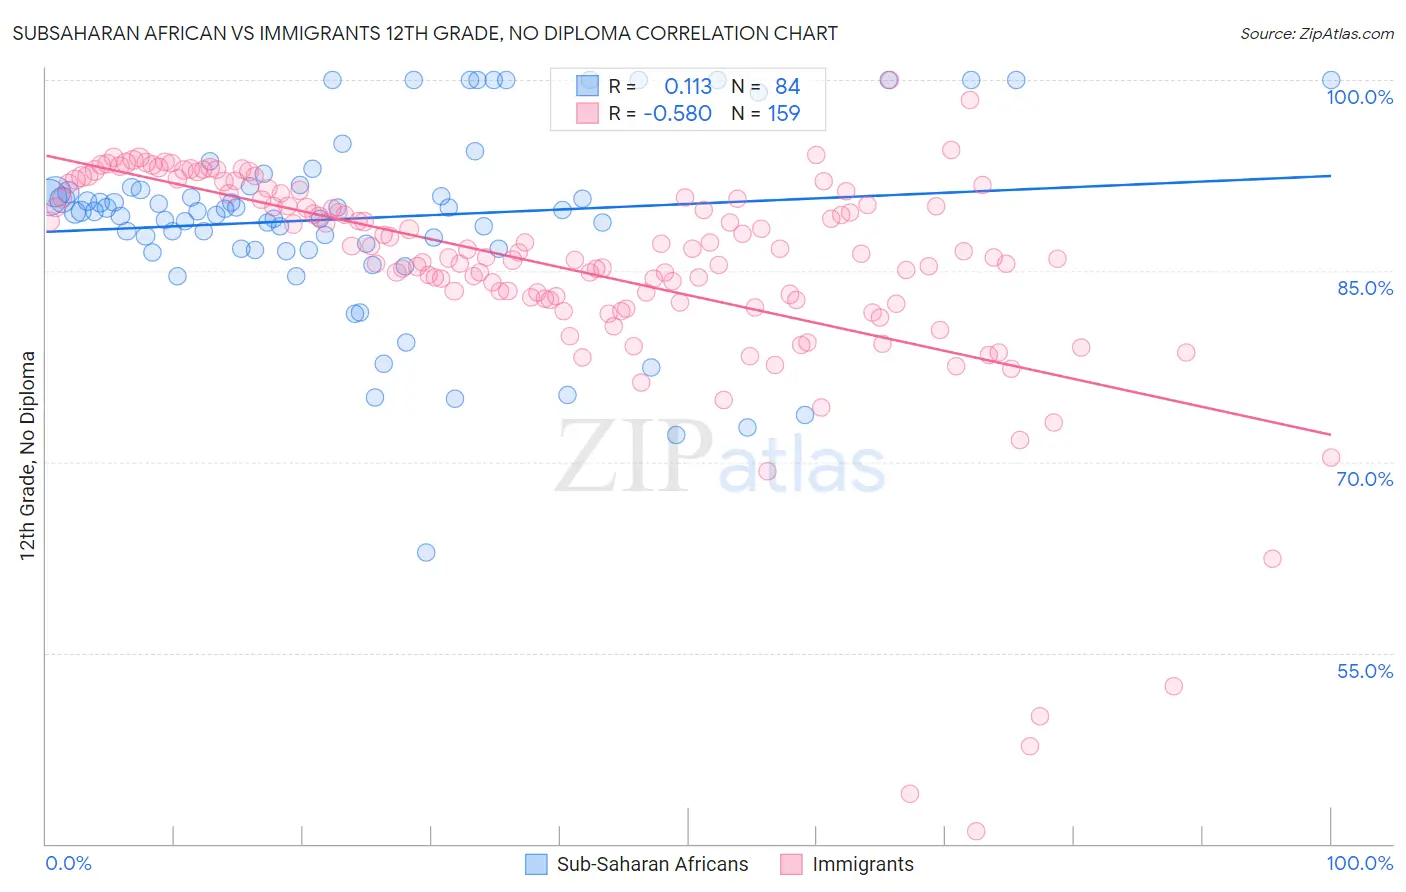
Subsaharan African vs Immigrants 12th Grade, No Diploma Correlation Chart
The statistical analysis conducted on geographies consisting of 508,219,008 people shows a poor positive correlation between the proportion of Sub-Saharan Africans and percentage of population with at least 12th grade (no diploma) education in the United States with a correlation coefficient (R) of 0.113 and weighted average of 90.1%. Similarly, the statistical analysis conducted on geographies consisting of 577,785,727 people shows a substantial negative correlation between the proportion of Immigrants and percentage of population with at least 12th grade (no diploma) education in the United States with a correlation coefficient (R) of -0.580 and weighted average of 88.2%, a difference of 2.1%.
12th Grade, No Diploma Correlation Summary
| Measurement | Subsaharan African | Immigrants |
| Minimum | 62.8% | 41.0% |
| Maximum | 100.0% | 100.0% |
| Range | 37.2% | 59.0% |
| Mean | 89.2% | 85.2% |
| Median | 89.7% | 86.4% |
| Interquartile 25% (IQ1) | 86.7% | 82.7% |
| Interquartile 75% (IQ3) | 91.6% | 91.1% |
| Interquartile Range (IQR) | 4.9% | 8.4% |
| Standard Deviation (Sample) | 7.3% | 9.1% |
| Standard Deviation (Population) | 7.3% | 9.0% |
Similar Demographics by 12th Grade, No Diploma
Demographics Similar to Sub-Saharan Africans by 12th Grade, No Diploma
In terms of 12th grade, no diploma, the demographic groups most similar to Sub-Saharan Africans are Inupiat (90.1%, a difference of 0.020%), Kiowa (90.0%, a difference of 0.020%), Immigrants from Colombia (90.1%, a difference of 0.030%), Immigrants from Middle Africa (90.0%, a difference of 0.030%), and Immigrants from Uzbekistan (90.1%, a difference of 0.050%).
| Demographics | Rating | Rank | 12th Grade, No Diploma |
| Blackfeet | 2.4 /100 | #232 | Tragic 90.1% |
| Immigrants | Thailand | 2.3 /100 | #233 | Tragic 90.1% |
| Immigrants | South America | 2.3 /100 | #234 | Tragic 90.1% |
| Colville | 2.3 /100 | #235 | Tragic 90.1% |
| Immigrants | Uzbekistan | 2.2 /100 | #236 | Tragic 90.1% |
| Immigrants | Colombia | 2.1 /100 | #237 | Tragic 90.1% |
| Inupiat | 2.0 /100 | #238 | Tragic 90.1% |
| Sub-Saharan Africans | 1.9 /100 | #239 | Tragic 90.1% |
| Kiowa | 1.7 /100 | #240 | Tragic 90.0% |
| Immigrants | Middle Africa | 1.7 /100 | #241 | Tragic 90.0% |
| Immigrants | Costa Rica | 1.6 /100 | #242 | Tragic 90.0% |
| Crow | 1.5 /100 | #243 | Tragic 90.0% |
| Taiwanese | 1.5 /100 | #244 | Tragic 90.0% |
| Immigrants | Uruguay | 1.4 /100 | #245 | Tragic 90.0% |
| Ghanaians | 1.3 /100 | #246 | Tragic 90.0% |
Demographics Similar to Immigrants by 12th Grade, No Diploma
In terms of 12th grade, no diploma, the demographic groups most similar to Immigrants are Fijian (88.2%, a difference of 0.020%), Pueblo (88.2%, a difference of 0.030%), Guyanese (88.3%, a difference of 0.040%), Immigrants from Haiti (88.2%, a difference of 0.080%), and Japanese (88.3%, a difference of 0.11%).
| Demographics | Rating | Rank | 12th Grade, No Diploma |
| Immigrants | Fiji | 0.0 /100 | #288 | Tragic 88.6% |
| Dutch West Indians | 0.0 /100 | #289 | Tragic 88.5% |
| British West Indians | 0.0 /100 | #290 | Tragic 88.5% |
| Haitians | 0.0 /100 | #291 | Tragic 88.5% |
| Immigrants | Grenada | 0.0 /100 | #292 | Tragic 88.4% |
| Japanese | 0.0 /100 | #293 | Tragic 88.3% |
| Guyanese | 0.0 /100 | #294 | Tragic 88.3% |
| Immigrants | Immigrants | 0.0 /100 | #295 | Tragic 88.2% |
| Fijians | 0.0 /100 | #296 | Tragic 88.2% |
| Pueblo | 0.0 /100 | #297 | Tragic 88.2% |
| Immigrants | Haiti | 0.0 /100 | #298 | Tragic 88.2% |
| Nepalese | 0.0 /100 | #299 | Tragic 88.1% |
| Immigrants | Guyana | 0.0 /100 | #300 | Tragic 88.1% |
| Immigrants | Cambodia | 0.0 /100 | #301 | Tragic 88.1% |
| Ecuadorians | 0.0 /100 | #302 | Tragic 88.0% |