Subsaharan African vs Marshallese In Labor Force | Age > 16
COMPARE
Subsaharan African
Marshallese
In Labor Force | Age > 16
In Labor Force | Age > 16 Comparison
Sub-Saharan Africans
Marshallese
66.2%
IN LABOR FORCE | AGE > 16
99.7/ 100
METRIC RATING
69th/ 347
METRIC RANK
64.2%
IN LABOR FORCE | AGE > 16
0.7/ 100
METRIC RATING
260th/ 347
METRIC RANK
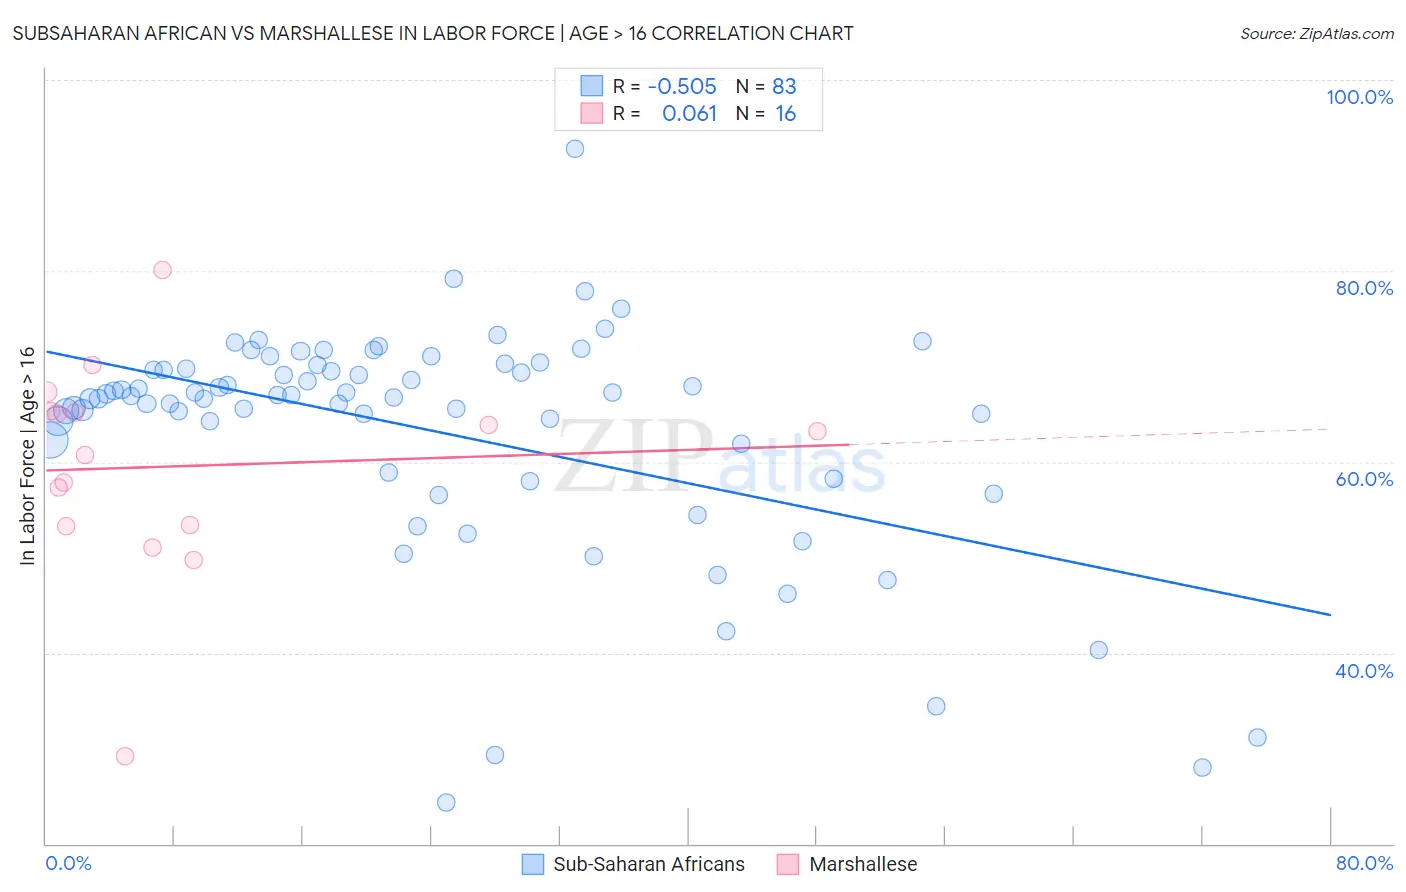
Subsaharan African vs Marshallese In Labor Force | Age > 16 Correlation Chart
The statistical analysis conducted on geographies consisting of 508,218,371 people shows a substantial negative correlation between the proportion of Sub-Saharan Africans and labor force participation rate among population ages 16 and over in the United States with a correlation coefficient (R) of -0.505 and weighted average of 66.2%. Similarly, the statistical analysis conducted on geographies consisting of 14,761,315 people shows a slight positive correlation between the proportion of Marshallese and labor force participation rate among population ages 16 and over in the United States with a correlation coefficient (R) of 0.061 and weighted average of 64.2%, a difference of 3.1%.
In Labor Force | Age > 16 Correlation Summary
| Measurement | Subsaharan African | Marshallese |
| Minimum | 24.3% | 29.2% |
| Maximum | 92.8% | 80.1% |
| Range | 68.5% | 50.9% |
| Mean | 63.3% | 59.5% |
| Median | 66.9% | 62.0% |
| Interquartile 25% (IQ1) | 58.8% | 53.3% |
| Interquartile 75% (IQ3) | 69.8% | 65.2% |
| Interquartile Range (IQR) | 11.0% | 11.9% |
| Standard Deviation (Sample) | 12.0% | 11.2% |
| Standard Deviation (Population) | 11.9% | 10.9% |
Similar Demographics by In Labor Force | Age > 16
Demographics Similar to Sub-Saharan Africans by In Labor Force | Age > 16
In terms of in labor force | age > 16, the demographic groups most similar to Sub-Saharan Africans are Immigrants from Egypt (66.2%, a difference of 0.0%), Asian (66.2%, a difference of 0.010%), Burmese (66.2%, a difference of 0.030%), Taiwanese (66.2%, a difference of 0.030%), and Immigrants from Vietnam (66.2%, a difference of 0.040%).
| Demographics | Rating | Rank | In Labor Force | Age > 16 |
| Indonesians | 99.8 /100 | #62 | Exceptional 66.3% |
| Venezuelans | 99.8 /100 | #63 | Exceptional 66.3% |
| Peruvians | 99.8 /100 | #64 | Exceptional 66.3% |
| Sri Lankans | 99.8 /100 | #65 | Exceptional 66.3% |
| Jordanians | 99.8 /100 | #66 | Exceptional 66.3% |
| Egyptians | 99.8 /100 | #67 | Exceptional 66.2% |
| Immigrants | Egypt | 99.7 /100 | #68 | Exceptional 66.2% |
| Sub-Saharan Africans | 99.7 /100 | #69 | Exceptional 66.2% |
| Asians | 99.7 /100 | #70 | Exceptional 66.2% |
| Burmese | 99.7 /100 | #71 | Exceptional 66.2% |
| Taiwanese | 99.7 /100 | #72 | Exceptional 66.2% |
| Immigrants | Vietnam | 99.7 /100 | #73 | Exceptional 66.2% |
| Immigrants | Korea | 99.7 /100 | #74 | Exceptional 66.2% |
| Immigrants | Singapore | 99.7 /100 | #75 | Exceptional 66.2% |
| Immigrants | Malaysia | 99.6 /100 | #76 | Exceptional 66.1% |
Demographics Similar to Marshallese by In Labor Force | Age > 16
In terms of in labor force | age > 16, the demographic groups most similar to Marshallese are Basque (64.2%, a difference of 0.0%), Immigrants from Western Europe (64.2%, a difference of 0.010%), Finnish (64.2%, a difference of 0.010%), Bahamian (64.2%, a difference of 0.030%), and Immigrants from Scotland (64.2%, a difference of 0.040%).
| Demographics | Rating | Rank | In Labor Force | Age > 16 |
| Czechoslovakians | 1.4 /100 | #253 | Tragic 64.3% |
| Immigrants | Uzbekistan | 1.4 /100 | #254 | Tragic 64.3% |
| Hispanics or Latinos | 1.1 /100 | #255 | Tragic 64.3% |
| Immigrants | Mexico | 1.0 /100 | #256 | Tragic 64.3% |
| Inupiat | 0.8 /100 | #257 | Tragic 64.3% |
| Immigrants | Scotland | 0.8 /100 | #258 | Tragic 64.2% |
| Immigrants | Western Europe | 0.7 /100 | #259 | Tragic 64.2% |
| Marshallese | 0.7 /100 | #260 | Tragic 64.2% |
| Basques | 0.7 /100 | #261 | Tragic 64.2% |
| Finns | 0.7 /100 | #262 | Tragic 64.2% |
| Bahamians | 0.6 /100 | #263 | Tragic 64.2% |
| Dutch | 0.6 /100 | #264 | Tragic 64.2% |
| Cubans | 0.5 /100 | #265 | Tragic 64.2% |
| Immigrants | England | 0.5 /100 | #266 | Tragic 64.2% |
| Canadians | 0.5 /100 | #267 | Tragic 64.1% |