Subsaharan African vs Asian 12th Grade, No Diploma
COMPARE
Subsaharan African
Asian
12th Grade, No Diploma
12th Grade, No Diploma Comparison
Sub-Saharan Africans
Asians
90.1%
12TH GRADE, NO DIPLOMA
1.9/ 100
METRIC RATING
239th/ 347
METRIC RANK
91.4%
12TH GRADE, NO DIPLOMA
71.9/ 100
METRIC RATING
156th/ 347
METRIC RANK
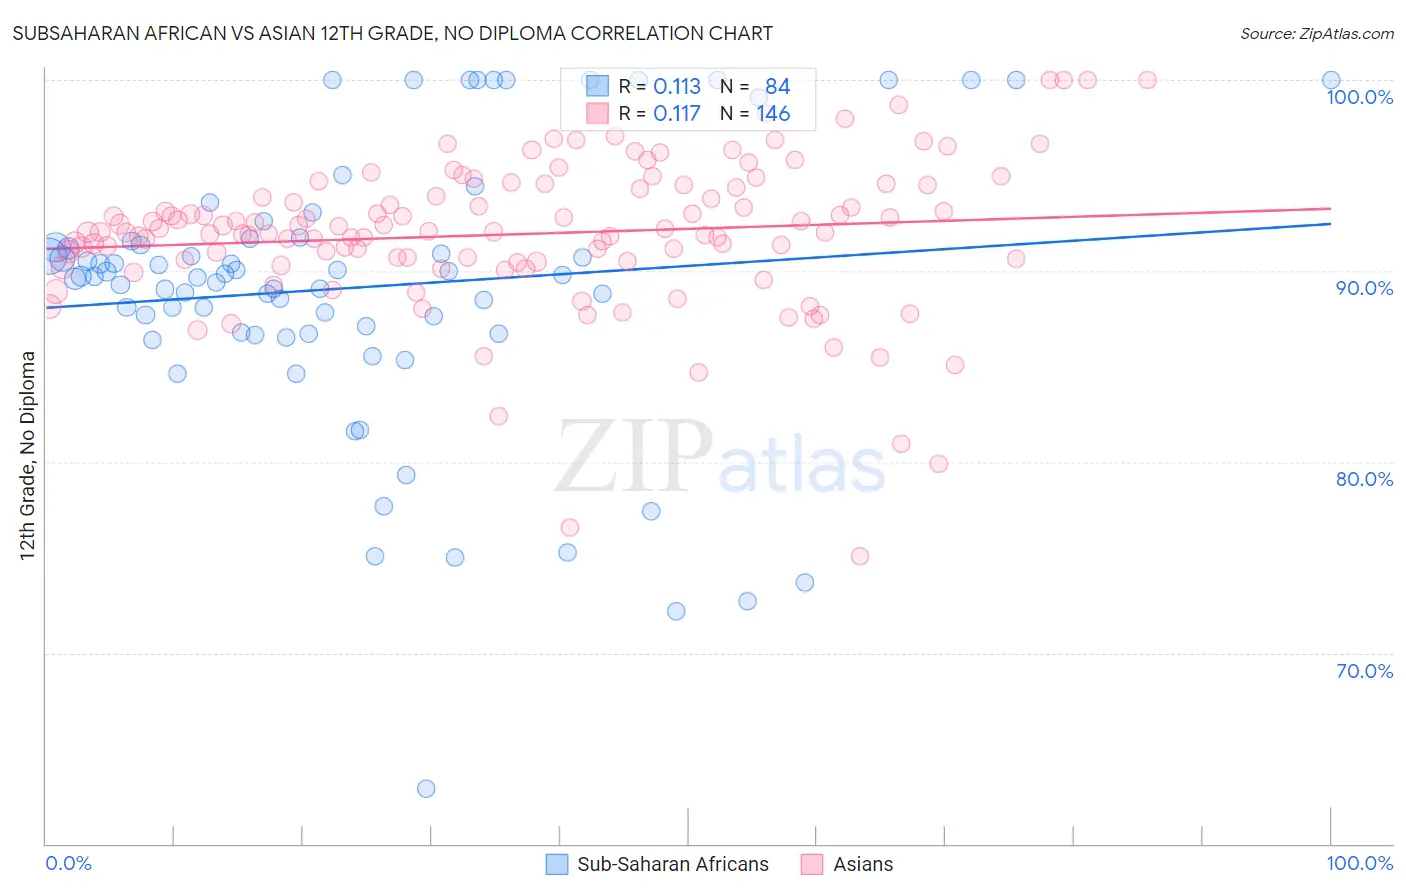
Subsaharan African vs Asian 12th Grade, No Diploma Correlation Chart
The statistical analysis conducted on geographies consisting of 508,219,008 people shows a poor positive correlation between the proportion of Sub-Saharan Africans and percentage of population with at least 12th grade (no diploma) education in the United States with a correlation coefficient (R) of 0.113 and weighted average of 90.1%. Similarly, the statistical analysis conducted on geographies consisting of 550,778,086 people shows a poor positive correlation between the proportion of Asians and percentage of population with at least 12th grade (no diploma) education in the United States with a correlation coefficient (R) of 0.117 and weighted average of 91.4%, a difference of 1.5%.
12th Grade, No Diploma Correlation Summary
| Measurement | Subsaharan African | Asian |
| Minimum | 62.8% | 75.1% |
| Maximum | 100.0% | 100.0% |
| Range | 37.2% | 24.9% |
| Mean | 89.2% | 91.9% |
| Median | 89.7% | 92.0% |
| Interquartile 25% (IQ1) | 86.7% | 90.5% |
| Interquartile 75% (IQ3) | 91.6% | 94.4% |
| Interquartile Range (IQR) | 4.9% | 3.8% |
| Standard Deviation (Sample) | 7.3% | 4.0% |
| Standard Deviation (Population) | 7.3% | 3.9% |
Similar Demographics by 12th Grade, No Diploma
Demographics Similar to Sub-Saharan Africans by 12th Grade, No Diploma
In terms of 12th grade, no diploma, the demographic groups most similar to Sub-Saharan Africans are Inupiat (90.1%, a difference of 0.020%), Kiowa (90.0%, a difference of 0.020%), Immigrants from Colombia (90.1%, a difference of 0.030%), Immigrants from Middle Africa (90.0%, a difference of 0.030%), and Immigrants from Uzbekistan (90.1%, a difference of 0.050%).
| Demographics | Rating | Rank | 12th Grade, No Diploma |
| Blackfeet | 2.4 /100 | #232 | Tragic 90.1% |
| Immigrants | Thailand | 2.3 /100 | #233 | Tragic 90.1% |
| Immigrants | South America | 2.3 /100 | #234 | Tragic 90.1% |
| Colville | 2.3 /100 | #235 | Tragic 90.1% |
| Immigrants | Uzbekistan | 2.2 /100 | #236 | Tragic 90.1% |
| Immigrants | Colombia | 2.1 /100 | #237 | Tragic 90.1% |
| Inupiat | 2.0 /100 | #238 | Tragic 90.1% |
| Sub-Saharan Africans | 1.9 /100 | #239 | Tragic 90.1% |
| Kiowa | 1.7 /100 | #240 | Tragic 90.0% |
| Immigrants | Middle Africa | 1.7 /100 | #241 | Tragic 90.0% |
| Immigrants | Costa Rica | 1.6 /100 | #242 | Tragic 90.0% |
| Crow | 1.5 /100 | #243 | Tragic 90.0% |
| Taiwanese | 1.5 /100 | #244 | Tragic 90.0% |
| Immigrants | Uruguay | 1.4 /100 | #245 | Tragic 90.0% |
| Ghanaians | 1.3 /100 | #246 | Tragic 90.0% |
Demographics Similar to Asians by 12th Grade, No Diploma
In terms of 12th grade, no diploma, the demographic groups most similar to Asians are Immigrants from Iraq (91.4%, a difference of 0.020%), Immigrants from Pakistan (91.4%, a difference of 0.020%), Immigrants from Kenya (91.5%, a difference of 0.030%), Iraqi (91.5%, a difference of 0.050%), and Immigrants from Northern Africa (91.4%, a difference of 0.080%).
| Demographics | Rating | Rank | 12th Grade, No Diploma |
| Ugandans | 79.0 /100 | #149 | Good 91.5% |
| Paraguayans | 78.9 /100 | #150 | Good 91.5% |
| Chippewa | 78.8 /100 | #151 | Good 91.5% |
| Kenyans | 77.4 /100 | #152 | Good 91.5% |
| Iraqis | 75.3 /100 | #153 | Good 91.5% |
| Immigrants | Kenya | 73.9 /100 | #154 | Good 91.5% |
| Immigrants | Iraq | 73.0 /100 | #155 | Good 91.4% |
| Asians | 71.9 /100 | #156 | Good 91.4% |
| Immigrants | Pakistan | 70.7 /100 | #157 | Good 91.4% |
| Immigrants | Northern Africa | 66.2 /100 | #158 | Good 91.4% |
| Laotians | 64.4 /100 | #159 | Good 91.3% |
| Immigrants | Albania | 64.1 /100 | #160 | Good 91.3% |
| Immigrants | Hong Kong | 63.8 /100 | #161 | Good 91.3% |
| Brazilians | 62.0 /100 | #162 | Good 91.3% |
| Immigrants | Asia | 61.5 /100 | #163 | Good 91.3% |