Spanish American Indian vs Sri Lankan Unemployment Among Women with Children Ages 6 to 17 years
COMPARE
Spanish American Indian
Sri Lankan
Unemployment Among Women with Children Ages 6 to 17 years
Unemployment Among Women with Children Ages 6 to 17 years Comparison
Spanish American Indians
Sri Lankans
8.2%
UNEMPLOYMENT AMONG WOMEN WITH CHILDREN AGES 6 TO 17 YEARS
100.0/ 100
METRIC RATING
62nd/ 347
METRIC RANK
8.5%
UNEMPLOYMENT AMONG WOMEN WITH CHILDREN AGES 6 TO 17 YEARS
98.7/ 100
METRIC RATING
95th/ 347
METRIC RANK
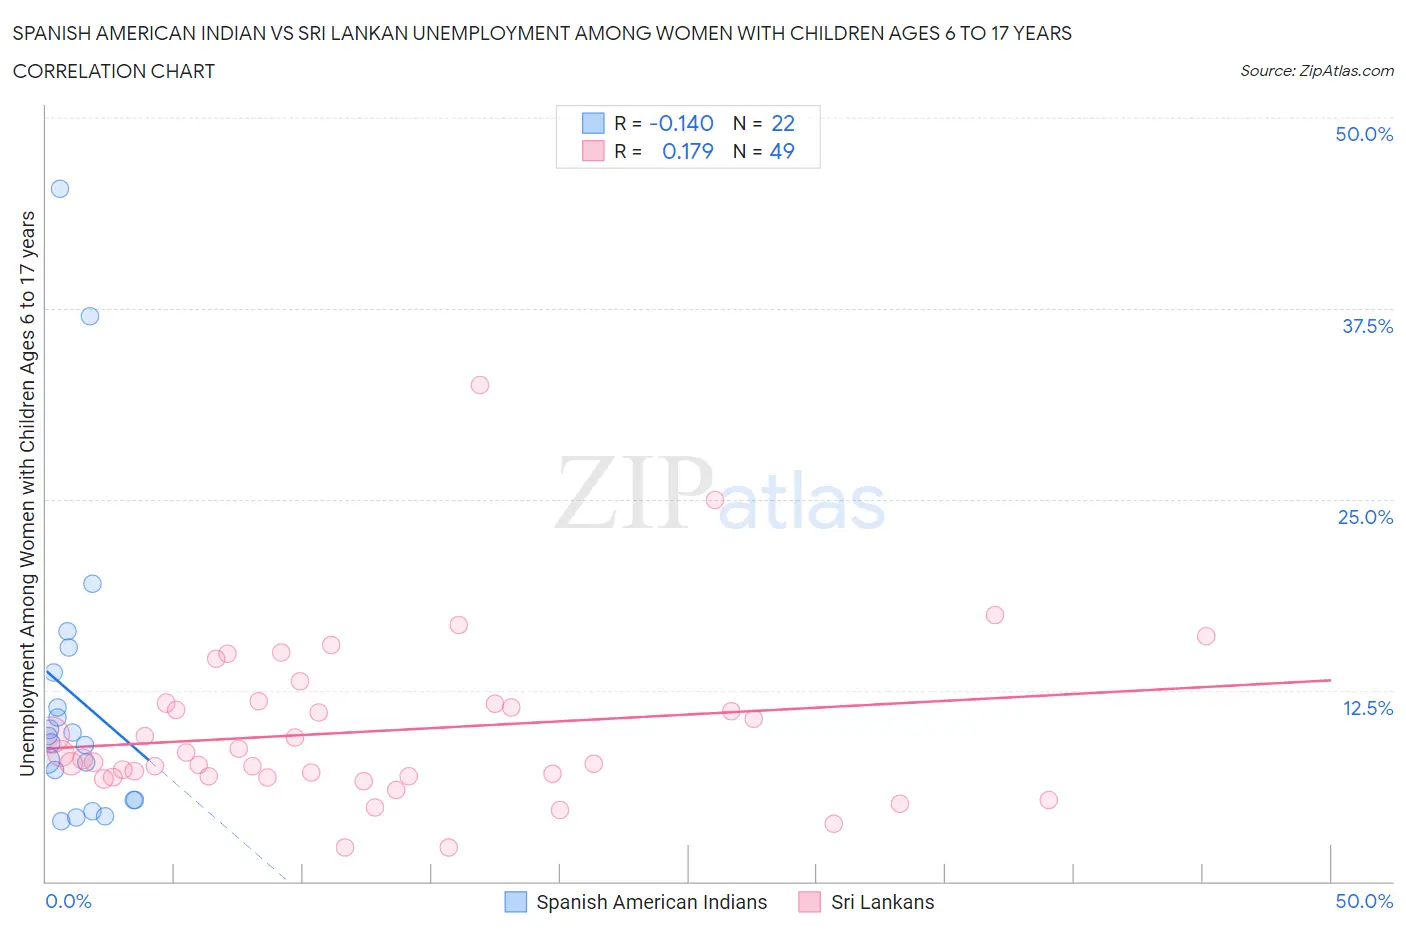
Spanish American Indian vs Sri Lankan Unemployment Among Women with Children Ages 6 to 17 years Correlation Chart
The statistical analysis conducted on geographies consisting of 68,050,108 people shows a poor negative correlation between the proportion of Spanish American Indians and unemployment rate among women with children between the ages 6 and 17 in the United States with a correlation coefficient (R) of -0.140 and weighted average of 8.2%. Similarly, the statistical analysis conducted on geographies consisting of 312,508,075 people shows a poor positive correlation between the proportion of Sri Lankans and unemployment rate among women with children between the ages 6 and 17 in the United States with a correlation coefficient (R) of 0.179 and weighted average of 8.5%, a difference of 4.1%.
Unemployment Among Women with Children Ages 6 to 17 years Correlation Summary
| Measurement | Spanish American Indian | Sri Lankan |
| Minimum | 4.0% | 2.2% |
| Maximum | 45.4% | 32.5% |
| Range | 41.4% | 30.3% |
| Mean | 12.1% | 9.8% |
| Median | 9.3% | 8.0% |
| Interquartile 25% (IQ1) | 5.3% | 6.8% |
| Interquartile 75% (IQ3) | 13.7% | 11.6% |
| Interquartile Range (IQR) | 8.4% | 4.8% |
| Standard Deviation (Sample) | 10.4% | 5.4% |
| Standard Deviation (Population) | 10.1% | 5.4% |
Similar Demographics by Unemployment Among Women with Children Ages 6 to 17 years
Demographics Similar to Spanish American Indians by Unemployment Among Women with Children Ages 6 to 17 years
In terms of unemployment among women with children ages 6 to 17 years, the demographic groups most similar to Spanish American Indians are Korean (8.2%, a difference of 0.030%), Immigrants from Philippines (8.2%, a difference of 0.22%), Basque (8.2%, a difference of 0.22%), Immigrants from Malaysia (8.2%, a difference of 0.28%), and Immigrants from South Eastern Asia (8.2%, a difference of 0.40%).
| Demographics | Rating | Rank | Unemployment Among Women with Children Ages 6 to 17 years |
| Immigrants | Japan | 100.0 /100 | #55 | Exceptional 8.2% |
| Immigrants | Bosnia and Herzegovina | 100.0 /100 | #56 | Exceptional 8.2% |
| Immigrants | Laos | 100.0 /100 | #57 | Exceptional 8.2% |
| Immigrants | Malaysia | 100.0 /100 | #58 | Exceptional 8.2% |
| Immigrants | Philippines | 100.0 /100 | #59 | Exceptional 8.2% |
| Basques | 100.0 /100 | #60 | Exceptional 8.2% |
| Koreans | 100.0 /100 | #61 | Exceptional 8.2% |
| Spanish American Indians | 100.0 /100 | #62 | Exceptional 8.2% |
| Immigrants | South Eastern Asia | 99.9 /100 | #63 | Exceptional 8.2% |
| Immigrants | Kuwait | 99.9 /100 | #64 | Exceptional 8.3% |
| Immigrants | Albania | 99.9 /100 | #65 | Exceptional 8.3% |
| Luxembourgers | 99.9 /100 | #66 | Exceptional 8.3% |
| Armenians | 99.9 /100 | #67 | Exceptional 8.3% |
| Marshallese | 99.9 /100 | #68 | Exceptional 8.3% |
| Immigrants | Thailand | 99.9 /100 | #69 | Exceptional 8.3% |
Demographics Similar to Sri Lankans by Unemployment Among Women with Children Ages 6 to 17 years
In terms of unemployment among women with children ages 6 to 17 years, the demographic groups most similar to Sri Lankans are Immigrants from Barbados (8.5%, a difference of 0.060%), German Russian (8.5%, a difference of 0.070%), Bolivian (8.5%, a difference of 0.15%), Australian (8.5%, a difference of 0.16%), and Malaysian (8.6%, a difference of 0.20%).
| Demographics | Rating | Rank | Unemployment Among Women with Children Ages 6 to 17 years |
| Immigrants | Vietnam | 99.1 /100 | #88 | Exceptional 8.5% |
| Paiute | 99.1 /100 | #89 | Exceptional 8.5% |
| Yugoslavians | 99.0 /100 | #90 | Exceptional 8.5% |
| Immigrants | Eastern Europe | 99.0 /100 | #91 | Exceptional 8.5% |
| Potawatomi | 99.0 /100 | #92 | Exceptional 8.5% |
| Australians | 98.9 /100 | #93 | Exceptional 8.5% |
| Immigrants | Barbados | 98.8 /100 | #94 | Exceptional 8.5% |
| Sri Lankans | 98.7 /100 | #95 | Exceptional 8.5% |
| German Russians | 98.6 /100 | #96 | Exceptional 8.5% |
| Bolivians | 98.5 /100 | #97 | Exceptional 8.5% |
| Malaysians | 98.5 /100 | #98 | Exceptional 8.6% |
| Immigrants | Lithuania | 98.4 /100 | #99 | Exceptional 8.6% |
| New Zealanders | 98.4 /100 | #100 | Exceptional 8.6% |
| Immigrants | Pakistan | 98.4 /100 | #101 | Exceptional 8.6% |
| Immigrants | South Africa | 98.3 /100 | #102 | Exceptional 8.6% |