Spanish American Indian vs Sri Lankan Associate's Degree
COMPARE
Spanish American Indian
Sri Lankan
Associate's Degree
Associate's Degree Comparison
Spanish American Indians
Sri Lankans
34.9%
ASSOCIATE'S DEGREE
0.0/ 100
METRIC RATING
335th/ 347
METRIC RANK
46.3%
ASSOCIATE'S DEGREE
47.6/ 100
METRIC RATING
179th/ 347
METRIC RANK
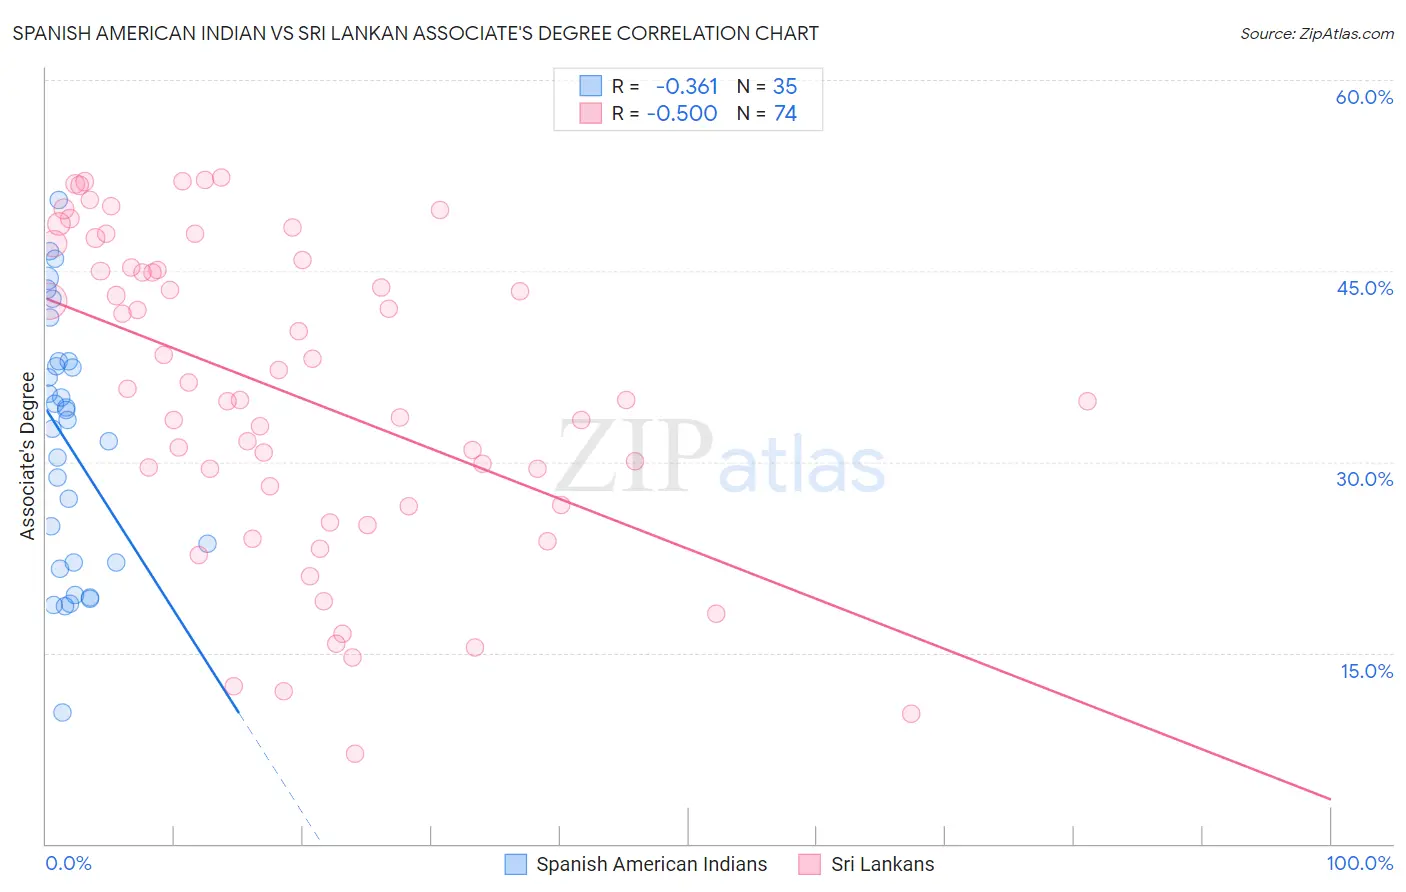
Spanish American Indian vs Sri Lankan Associate's Degree Correlation Chart
The statistical analysis conducted on geographies consisting of 73,150,359 people shows a mild negative correlation between the proportion of Spanish American Indians and percentage of population with at least associate's degree education in the United States with a correlation coefficient (R) of -0.361 and weighted average of 34.9%. Similarly, the statistical analysis conducted on geographies consisting of 440,543,286 people shows a substantial negative correlation between the proportion of Sri Lankans and percentage of population with at least associate's degree education in the United States with a correlation coefficient (R) of -0.500 and weighted average of 46.3%, a difference of 32.7%.
Associate's Degree Correlation Summary
| Measurement | Spanish American Indian | Sri Lankan |
| Minimum | 10.3% | 7.0% |
| Maximum | 50.6% | 52.3% |
| Range | 40.3% | 45.3% |
| Mean | 31.4% | 35.4% |
| Median | 33.2% | 35.3% |
| Interquartile 25% (IQ1) | 22.0% | 26.6% |
| Interquartile 75% (IQ3) | 37.9% | 45.3% |
| Interquartile Range (IQR) | 15.8% | 18.7% |
| Standard Deviation (Sample) | 9.9% | 12.2% |
| Standard Deviation (Population) | 9.8% | 12.1% |
Similar Demographics by Associate's Degree
Demographics Similar to Spanish American Indians by Associate's Degree
In terms of associate's degree, the demographic groups most similar to Spanish American Indians are Native/Alaskan (34.9%, a difference of 0.14%), Mexican (35.0%, a difference of 0.37%), Immigrants from Central America (35.0%, a difference of 0.45%), Hopi (34.6%, a difference of 0.88%), and Lumbee (34.1%, a difference of 2.2%).
| Demographics | Rating | Rank | Associate's Degree |
| Alaskan Athabascans | 0.0 /100 | #328 | Tragic 36.5% |
| Paiute | 0.0 /100 | #329 | Tragic 36.4% |
| Apache | 0.0 /100 | #330 | Tragic 36.2% |
| Immigrants | Azores | 0.0 /100 | #331 | Tragic 35.6% |
| Immigrants | Central America | 0.0 /100 | #332 | Tragic 35.0% |
| Mexicans | 0.0 /100 | #333 | Tragic 35.0% |
| Natives/Alaskans | 0.0 /100 | #334 | Tragic 34.9% |
| Spanish American Indians | 0.0 /100 | #335 | Tragic 34.9% |
| Hopi | 0.0 /100 | #336 | Tragic 34.6% |
| Lumbee | 0.0 /100 | #337 | Tragic 34.1% |
| Pueblo | 0.0 /100 | #338 | Tragic 34.0% |
| Immigrants | Mexico | 0.0 /100 | #339 | Tragic 33.7% |
| Navajo | 0.0 /100 | #340 | Tragic 32.6% |
| Inupiat | 0.0 /100 | #341 | Tragic 32.6% |
| Yakama | 0.0 /100 | #342 | Tragic 32.3% |
Demographics Similar to Sri Lankans by Associate's Degree
In terms of associate's degree, the demographic groups most similar to Sri Lankans are Immigrants from Bosnia and Herzegovina (46.3%, a difference of 0.050%), Slovak (46.3%, a difference of 0.060%), Finnish (46.3%, a difference of 0.070%), Bermudan (46.2%, a difference of 0.090%), and Belgian (46.3%, a difference of 0.10%).
| Demographics | Rating | Rank | Associate's Degree |
| Peruvians | 50.5 /100 | #172 | Average 46.4% |
| Immigrants | Iraq | 50.3 /100 | #173 | Average 46.4% |
| English | 50.0 /100 | #174 | Average 46.4% |
| Belgians | 48.9 /100 | #175 | Average 46.3% |
| Finns | 48.5 /100 | #176 | Average 46.3% |
| Slovaks | 48.4 /100 | #177 | Average 46.3% |
| Immigrants | Bosnia and Herzegovina | 48.3 /100 | #178 | Average 46.3% |
| Sri Lankans | 47.6 /100 | #179 | Average 46.3% |
| Bermudans | 46.4 /100 | #180 | Average 46.2% |
| Immigrants | Colombia | 41.3 /100 | #181 | Average 46.0% |
| Swiss | 40.4 /100 | #182 | Average 46.0% |
| Yugoslavians | 40.2 /100 | #183 | Average 46.0% |
| Czechoslovakians | 40.0 /100 | #184 | Average 46.0% |
| Costa Ricans | 38.6 /100 | #185 | Fair 46.0% |
| Welsh | 37.9 /100 | #186 | Fair 45.9% |