Bhutanese vs Sri Lankan College, Under 1 year
COMPARE
Bhutanese
Sri Lankan
College, Under 1 year
College, Under 1 year Comparison
Bhutanese
Sri Lankans
70.3%
COLLEGE, UNDER 1 YEAR
99.9/ 100
METRIC RATING
39th/ 347
METRIC RANK
65.2%
COLLEGE, UNDER 1 YEAR
41.7/ 100
METRIC RATING
185th/ 347
METRIC RANK
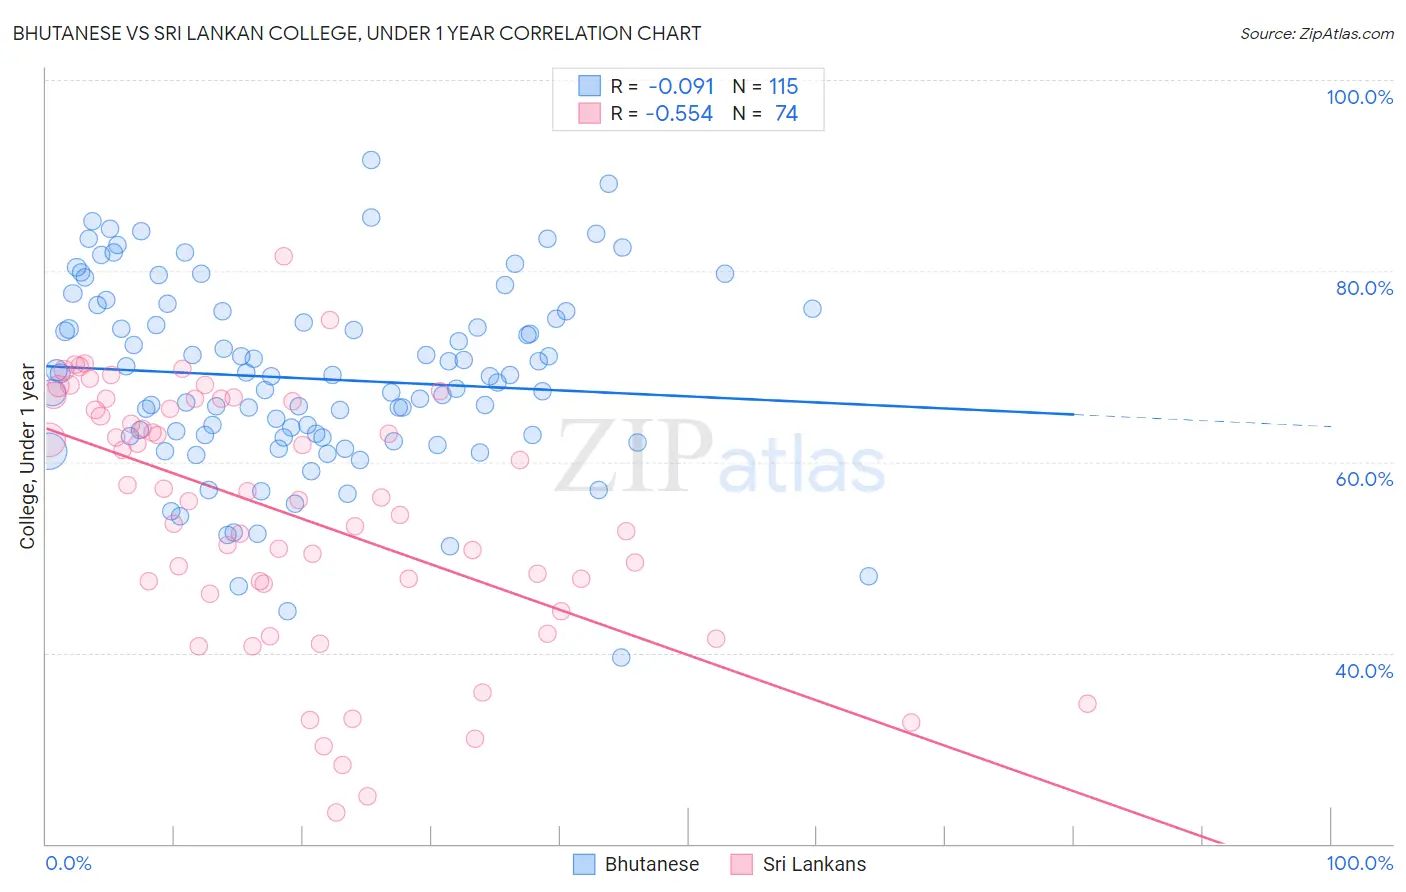
Bhutanese vs Sri Lankan College, Under 1 year Correlation Chart
The statistical analysis conducted on geographies consisting of 455,589,094 people shows a slight negative correlation between the proportion of Bhutanese and percentage of population with at least college, under 1 year education in the United States with a correlation coefficient (R) of -0.091 and weighted average of 70.3%. Similarly, the statistical analysis conducted on geographies consisting of 440,590,245 people shows a substantial negative correlation between the proportion of Sri Lankans and percentage of population with at least college, under 1 year education in the United States with a correlation coefficient (R) of -0.554 and weighted average of 65.2%, a difference of 7.9%.
College, Under 1 year Correlation Summary
| Measurement | Bhutanese | Sri Lankan |
| Minimum | 39.5% | 23.3% |
| Maximum | 91.6% | 81.5% |
| Range | 52.1% | 58.3% |
| Mean | 68.7% | 54.6% |
| Median | 68.9% | 56.1% |
| Interquartile 25% (IQ1) | 62.6% | 47.3% |
| Interquartile 75% (IQ3) | 75.7% | 66.4% |
| Interquartile Range (IQR) | 13.1% | 19.1% |
| Standard Deviation (Sample) | 9.9% | 13.3% |
| Standard Deviation (Population) | 9.8% | 13.2% |
Similar Demographics by College, Under 1 year
Demographics Similar to Bhutanese by College, Under 1 year
In terms of college, under 1 year, the demographic groups most similar to Bhutanese are Immigrants from Turkey (70.3%, a difference of 0.010%), Australian (70.4%, a difference of 0.020%), Immigrants from Kuwait (70.3%, a difference of 0.050%), Immigrants from Saudi Arabia (70.4%, a difference of 0.090%), and Immigrants from Lithuania (70.3%, a difference of 0.10%).
| Demographics | Rating | Rank | College, Under 1 year |
| Turks | 99.9 /100 | #32 | Exceptional 70.7% |
| Immigrants | South Africa | 99.9 /100 | #33 | Exceptional 70.6% |
| Estonians | 99.9 /100 | #34 | Exceptional 70.6% |
| Russians | 99.9 /100 | #35 | Exceptional 70.5% |
| Immigrants | Sri Lanka | 99.9 /100 | #36 | Exceptional 70.5% |
| Immigrants | Saudi Arabia | 99.9 /100 | #37 | Exceptional 70.4% |
| Australians | 99.9 /100 | #38 | Exceptional 70.4% |
| Bhutanese | 99.9 /100 | #39 | Exceptional 70.3% |
| Immigrants | Turkey | 99.9 /100 | #40 | Exceptional 70.3% |
| Immigrants | Kuwait | 99.9 /100 | #41 | Exceptional 70.3% |
| Immigrants | Lithuania | 99.9 /100 | #42 | Exceptional 70.3% |
| Israelis | 99.9 /100 | #43 | Exceptional 70.2% |
| New Zealanders | 99.9 /100 | #44 | Exceptional 70.2% |
| Immigrants | Norway | 99.9 /100 | #45 | Exceptional 70.2% |
| Immigrants | Latvia | 99.9 /100 | #46 | Exceptional 70.1% |
Demographics Similar to Sri Lankans by College, Under 1 year
In terms of college, under 1 year, the demographic groups most similar to Sri Lankans are Bermudan (65.2%, a difference of 0.010%), Immigrants from Poland (65.2%, a difference of 0.040%), Immigrants from Sierra Leone (65.1%, a difference of 0.090%), Immigrants from Africa (65.3%, a difference of 0.13%), and Spaniard (65.3%, a difference of 0.17%).
| Demographics | Rating | Rank | College, Under 1 year |
| German Russians | 48.3 /100 | #178 | Average 65.4% |
| Guamanians/Chamorros | 48.2 /100 | #179 | Average 65.4% |
| Dutch | 46.1 /100 | #180 | Average 65.3% |
| Spaniards | 45.5 /100 | #181 | Average 65.3% |
| Immigrants | Africa | 44.7 /100 | #182 | Average 65.3% |
| Immigrants | Poland | 42.6 /100 | #183 | Average 65.2% |
| Bermudans | 42.0 /100 | #184 | Average 65.2% |
| Sri Lankans | 41.7 /100 | #185 | Average 65.2% |
| Immigrants | Sierra Leone | 39.7 /100 | #186 | Fair 65.1% |
| Immigrants | Southern Europe | 34.3 /100 | #187 | Fair 64.9% |
| Immigrants | Albania | 32.0 /100 | #188 | Fair 64.9% |
| Spanish | 31.6 /100 | #189 | Fair 64.9% |
| Immigrants | Philippines | 30.1 /100 | #190 | Fair 64.8% |
| Immigrants | Armenia | 28.1 /100 | #191 | Fair 64.7% |
| Immigrants | Thailand | 27.0 /100 | #192 | Fair 64.7% |