Spaniard vs Taiwanese GED/Equivalency
COMPARE
Spaniard
Taiwanese
GED/Equivalency
GED/Equivalency Comparison
Spaniards
Taiwanese
85.4%
GED/EQUIVALENCY
31.9/ 100
METRIC RATING
186th/ 347
METRIC RANK
84.7%
GED/EQUIVALENCY
8.1/ 100
METRIC RATING
221st/ 347
METRIC RANK
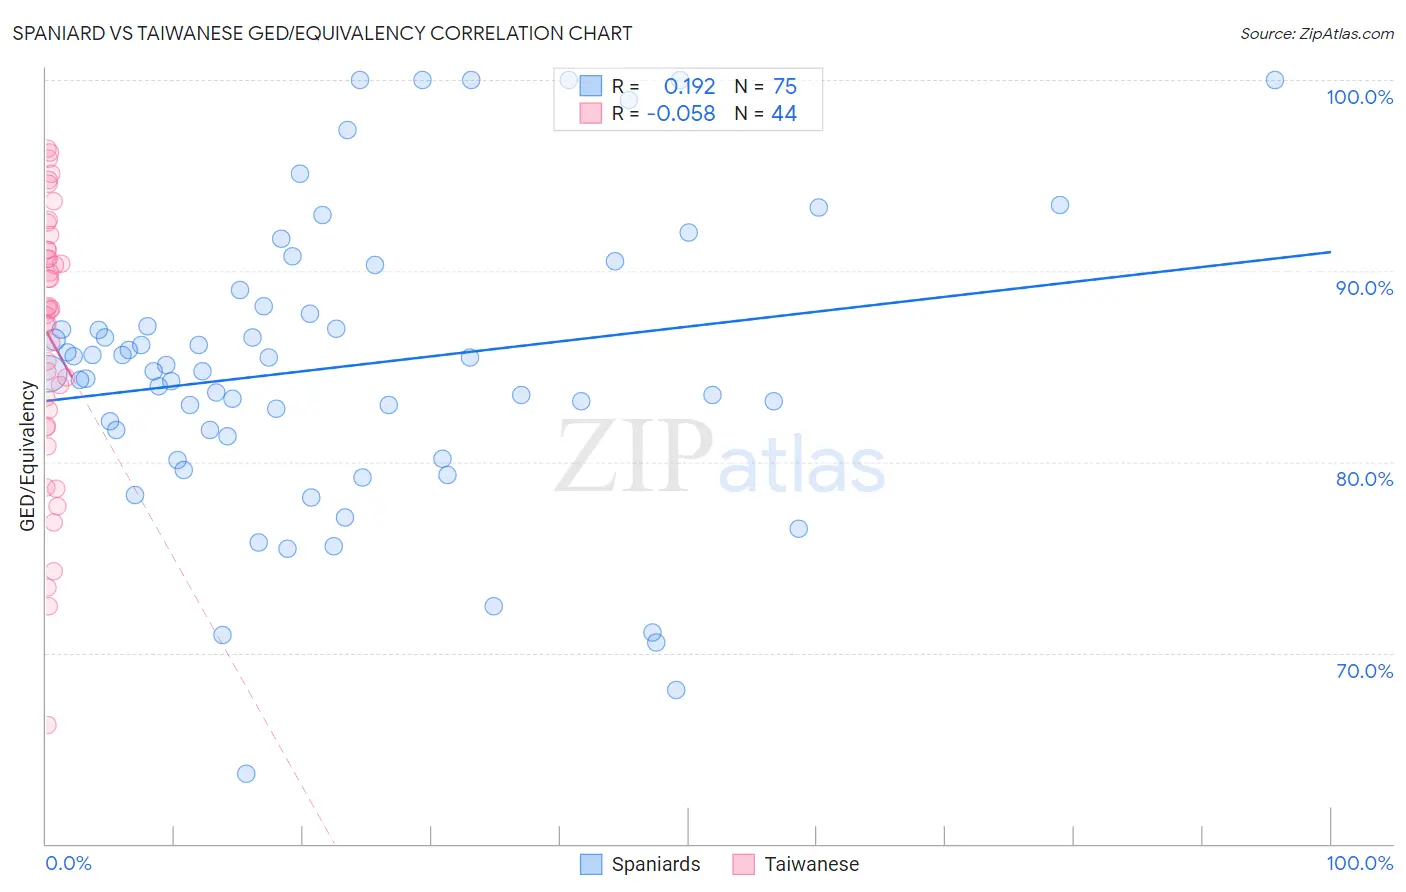
Spaniard vs Taiwanese GED/Equivalency Correlation Chart
The statistical analysis conducted on geographies consisting of 443,545,703 people shows a poor positive correlation between the proportion of Spaniards and percentage of population with at least ged/equivalency education in the United States with a correlation coefficient (R) of 0.192 and weighted average of 85.4%. Similarly, the statistical analysis conducted on geographies consisting of 31,724,936 people shows a slight negative correlation between the proportion of Taiwanese and percentage of population with at least ged/equivalency education in the United States with a correlation coefficient (R) of -0.058 and weighted average of 84.7%, a difference of 0.87%.
GED/Equivalency Correlation Summary
| Measurement | Spaniard | Taiwanese |
| Minimum | 63.6% | 66.2% |
| Maximum | 100.0% | 96.4% |
| Range | 36.4% | 30.1% |
| Mean | 85.0% | 86.5% |
| Median | 84.7% | 88.0% |
| Interquartile 25% (IQ1) | 81.4% | 82.3% |
| Interquartile 75% (IQ3) | 88.2% | 91.1% |
| Interquartile Range (IQR) | 6.8% | 8.8% |
| Standard Deviation (Sample) | 7.8% | 7.0% |
| Standard Deviation (Population) | 7.7% | 7.0% |
Similar Demographics by GED/Equivalency
Demographics Similar to Spaniards by GED/Equivalency
In terms of ged/equivalency, the demographic groups most similar to Spaniards are Spanish (85.4%, a difference of 0.020%), Immigrants from Oceania (85.5%, a difference of 0.040%), Immigrants from Sudan (85.5%, a difference of 0.050%), Immigrants from Afghanistan (85.4%, a difference of 0.050%), and Sudanese (85.5%, a difference of 0.070%).
| Demographics | Rating | Rank | GED/Equivalency |
| Aleuts | 40.5 /100 | #179 | Average 85.6% |
| Immigrants | Southern Europe | 38.4 /100 | #180 | Fair 85.5% |
| Moroccans | 37.7 /100 | #181 | Fair 85.5% |
| Sudanese | 35.2 /100 | #182 | Fair 85.5% |
| Immigrants | Sudan | 34.2 /100 | #183 | Fair 85.5% |
| Immigrants | Oceania | 33.6 /100 | #184 | Fair 85.5% |
| Spanish | 32.8 /100 | #185 | Fair 85.4% |
| Spaniards | 31.9 /100 | #186 | Fair 85.4% |
| Immigrants | Afghanistan | 29.8 /100 | #187 | Fair 85.4% |
| Immigrants | Sierra Leone | 29.0 /100 | #188 | Fair 85.4% |
| Guamanians/Chamorros | 28.4 /100 | #189 | Fair 85.3% |
| Alaskan Athabascans | 27.5 /100 | #190 | Fair 85.3% |
| South American Indians | 22.8 /100 | #191 | Fair 85.2% |
| Immigrants | Nonimmigrants | 22.7 /100 | #192 | Fair 85.2% |
| Delaware | 22.2 /100 | #193 | Fair 85.2% |
Demographics Similar to Taiwanese by GED/Equivalency
In terms of ged/equivalency, the demographic groups most similar to Taiwanese are Potawatomi (84.7%, a difference of 0.010%), American (84.7%, a difference of 0.010%), Immigrants from Micronesia (84.7%, a difference of 0.040%), Nigerian (84.7%, a difference of 0.040%), and Alaska Native (84.7%, a difference of 0.040%).
| Demographics | Rating | Rank | GED/Equivalency |
| Osage | 9.5 /100 | #214 | Tragic 84.8% |
| Peruvians | 9.2 /100 | #215 | Tragic 84.7% |
| Immigrants | Micronesia | 8.7 /100 | #216 | Tragic 84.7% |
| Nigerians | 8.6 /100 | #217 | Tragic 84.7% |
| Alaska Natives | 8.6 /100 | #218 | Tragic 84.7% |
| Potawatomi | 8.2 /100 | #219 | Tragic 84.7% |
| Americans | 8.2 /100 | #220 | Tragic 84.7% |
| Taiwanese | 8.1 /100 | #221 | Tragic 84.7% |
| Iroquois | 7.5 /100 | #222 | Tragic 84.6% |
| Immigrants | Uzbekistan | 7.1 /100 | #223 | Tragic 84.6% |
| French American Indians | 6.3 /100 | #224 | Tragic 84.6% |
| Immigrants | Thailand | 5.8 /100 | #225 | Tragic 84.5% |
| Immigrants | Zaire | 5.5 /100 | #226 | Tragic 84.5% |
| Immigrants | Costa Rica | 5.4 /100 | #227 | Tragic 84.5% |
| Immigrants | Liberia | 4.9 /100 | #228 | Tragic 84.4% |