Spaniard vs Taiwanese Cognitive Disability
COMPARE
Spaniard
Taiwanese
Cognitive Disability
Cognitive Disability Comparison
Spaniards
Taiwanese
17.3%
COGNITIVE DISABILITY
40.3/ 100
METRIC RATING
183rd/ 347
METRIC RANK
17.6%
COGNITIVE DISABILITY
7.7/ 100
METRIC RATING
211th/ 347
METRIC RANK
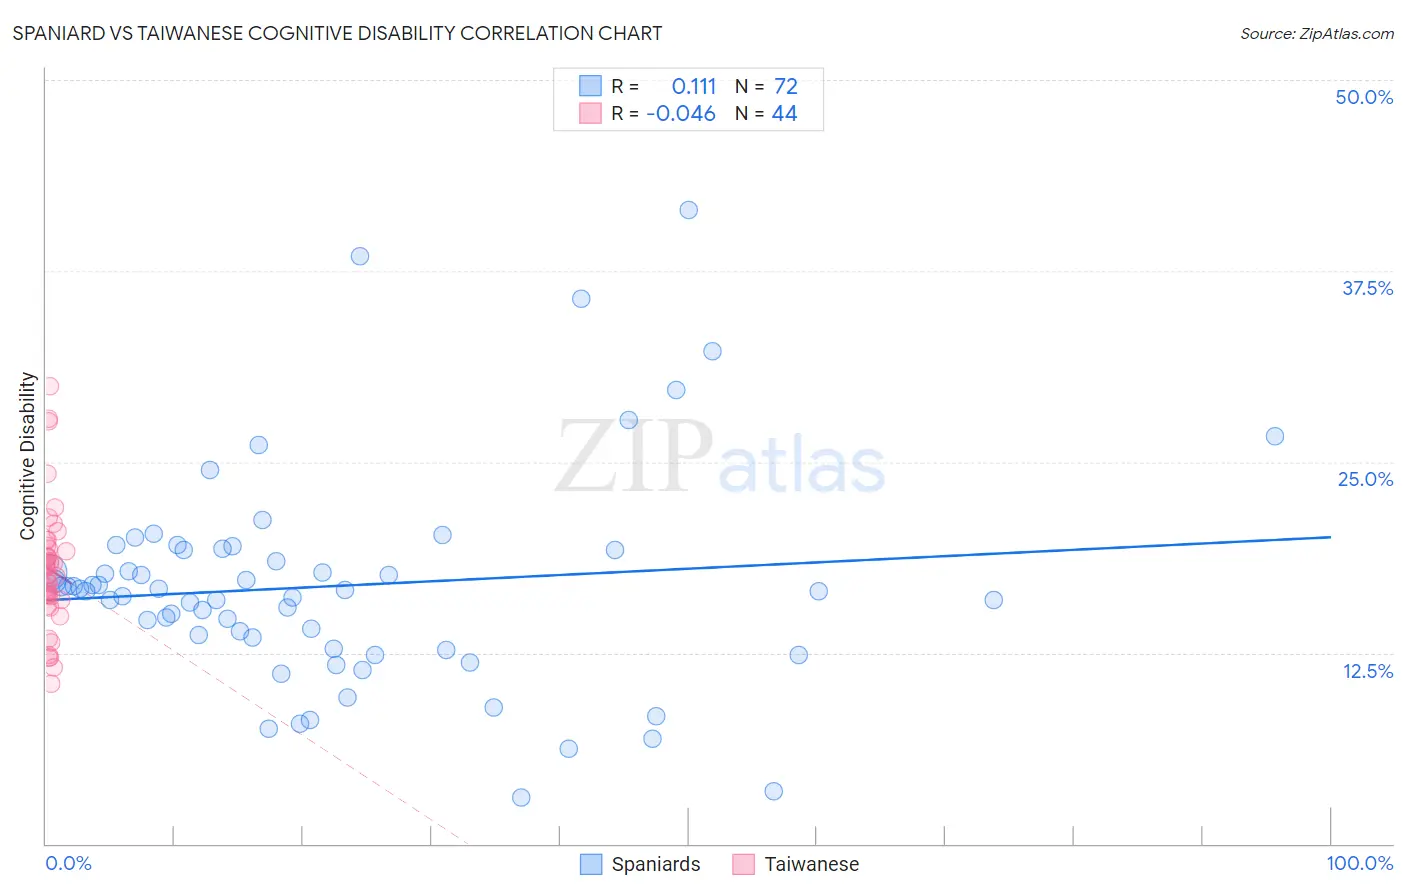
Spaniard vs Taiwanese Cognitive Disability Correlation Chart
The statistical analysis conducted on geographies consisting of 443,445,256 people shows a poor positive correlation between the proportion of Spaniards and percentage of population with cognitive disability in the United States with a correlation coefficient (R) of 0.111 and weighted average of 17.3%. Similarly, the statistical analysis conducted on geographies consisting of 31,724,936 people shows no correlation between the proportion of Taiwanese and percentage of population with cognitive disability in the United States with a correlation coefficient (R) of -0.046 and weighted average of 17.6%, a difference of 1.5%.
Cognitive Disability Correlation Summary
| Measurement | Spaniard | Taiwanese |
| Minimum | 3.0% | 10.5% |
| Maximum | 41.5% | 30.0% |
| Range | 38.5% | 19.5% |
| Mean | 16.9% | 17.9% |
| Median | 16.6% | 17.8% |
| Interquartile 25% (IQ1) | 13.1% | 16.1% |
| Interquartile 75% (IQ3) | 19.2% | 19.4% |
| Interquartile Range (IQR) | 6.1% | 3.3% |
| Standard Deviation (Sample) | 7.1% | 4.1% |
| Standard Deviation (Population) | 7.0% | 4.0% |
Similar Demographics by Cognitive Disability
Demographics Similar to Spaniards by Cognitive Disability
In terms of cognitive disability, the demographic groups most similar to Spaniards are Crow (17.3%, a difference of 0.040%), Afghan (17.3%, a difference of 0.060%), Immigrants from Guyana (17.3%, a difference of 0.070%), Arab (17.3%, a difference of 0.070%), and Pakistani (17.3%, a difference of 0.10%).
| Demographics | Rating | Rank | Cognitive Disability |
| Shoshone | 49.2 /100 | #176 | Average 17.3% |
| Ute | 49.1 /100 | #177 | Average 17.3% |
| Spanish | 48.9 /100 | #178 | Average 17.3% |
| Sioux | 48.6 /100 | #179 | Average 17.3% |
| Pakistanis | 43.9 /100 | #180 | Average 17.3% |
| Immigrants | Guyana | 42.9 /100 | #181 | Average 17.3% |
| Arabs | 42.8 /100 | #182 | Average 17.3% |
| Spaniards | 40.3 /100 | #183 | Average 17.3% |
| Crow | 39.1 /100 | #184 | Fair 17.3% |
| Afghans | 38.2 /100 | #185 | Fair 17.3% |
| Cambodians | 35.9 /100 | #186 | Fair 17.3% |
| Immigrants | Fiji | 33.7 /100 | #187 | Fair 17.4% |
| Immigrants | France | 29.8 /100 | #188 | Fair 17.4% |
| Immigrants | Western Asia | 29.5 /100 | #189 | Fair 17.4% |
| Immigrants | Spain | 27.7 /100 | #190 | Fair 17.4% |
Demographics Similar to Taiwanese by Cognitive Disability
In terms of cognitive disability, the demographic groups most similar to Taiwanese are Immigrants from Oceania (17.6%, a difference of 0.040%), Hawaiian (17.6%, a difference of 0.050%), Immigrants from Jamaica (17.6%, a difference of 0.070%), Immigrants from El Salvador (17.6%, a difference of 0.080%), and Immigrants from Trinidad and Tobago (17.6%, a difference of 0.090%).
| Demographics | Rating | Rank | Cognitive Disability |
| Immigrants | Zimbabwe | 11.0 /100 | #204 | Poor 17.5% |
| Puget Sound Salish | 10.9 /100 | #205 | Poor 17.5% |
| Alaska Natives | 10.4 /100 | #206 | Poor 17.5% |
| Immigrants | Latin America | 9.7 /100 | #207 | Tragic 17.6% |
| Immigrants | Cameroon | 9.3 /100 | #208 | Tragic 17.6% |
| Immigrants | Trinidad and Tobago | 8.7 /100 | #209 | Tragic 17.6% |
| Immigrants | Jamaica | 8.5 /100 | #210 | Tragic 17.6% |
| Taiwanese | 7.7 /100 | #211 | Tragic 17.6% |
| Immigrants | Oceania | 7.3 /100 | #212 | Tragic 17.6% |
| Hawaiians | 7.2 /100 | #213 | Tragic 17.6% |
| Immigrants | El Salvador | 7.0 /100 | #214 | Tragic 17.6% |
| Alaskan Athabascans | 6.9 /100 | #215 | Tragic 17.6% |
| Okinawans | 6.8 /100 | #216 | Tragic 17.6% |
| Salvadorans | 6.7 /100 | #217 | Tragic 17.6% |
| Icelanders | 6.4 /100 | #218 | Tragic 17.6% |