Spaniard vs Taiwanese College, Under 1 year
COMPARE
Spaniard
Taiwanese
College, Under 1 year
College, Under 1 year Comparison
Spaniards
Taiwanese
65.3%
COLLEGE, UNDER 1 YEAR
45.5/ 100
METRIC RATING
181st/ 347
METRIC RANK
66.4%
COLLEGE, UNDER 1 YEAR
78.6/ 100
METRIC RATING
148th/ 347
METRIC RANK
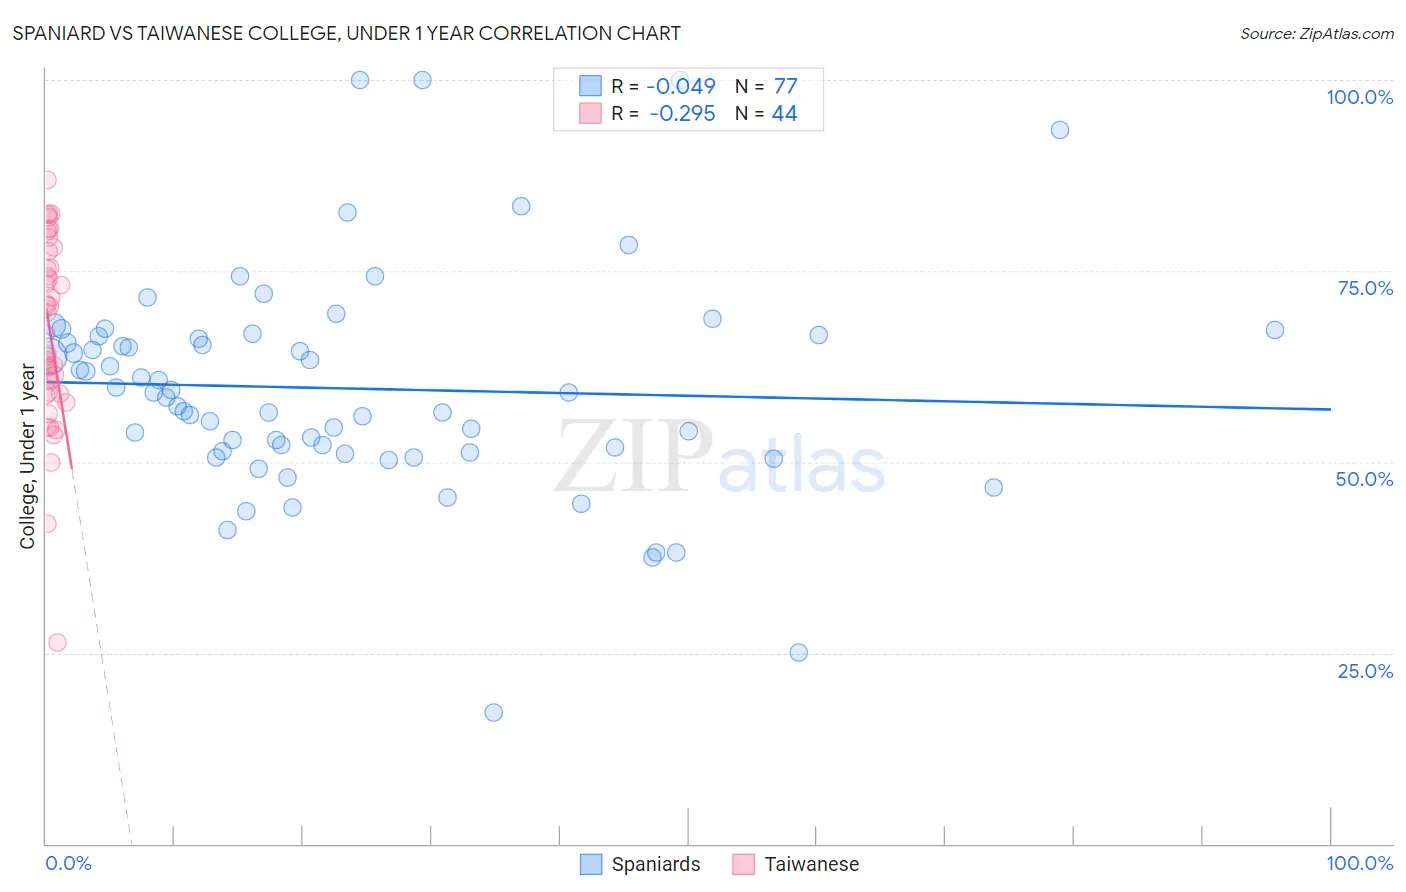
Spaniard vs Taiwanese College, Under 1 year Correlation Chart
The statistical analysis conducted on geographies consisting of 443,543,124 people shows no correlation between the proportion of Spaniards and percentage of population with at least college, under 1 year education in the United States with a correlation coefficient (R) of -0.049 and weighted average of 65.3%. Similarly, the statistical analysis conducted on geographies consisting of 31,724,936 people shows a weak negative correlation between the proportion of Taiwanese and percentage of population with at least college, under 1 year education in the United States with a correlation coefficient (R) of -0.295 and weighted average of 66.4%, a difference of 1.6%.
College, Under 1 year Correlation Summary
| Measurement | Spaniard | Taiwanese |
| Minimum | 17.2% | 26.4% |
| Maximum | 100.0% | 86.9% |
| Range | 82.8% | 60.6% |
| Mean | 59.6% | 66.9% |
| Median | 59.1% | 68.2% |
| Interquartile 25% (IQ1) | 51.3% | 58.9% |
| Interquartile 75% (IQ3) | 66.5% | 76.5% |
| Interquartile Range (IQR) | 15.2% | 17.6% |
| Standard Deviation (Sample) | 14.6% | 12.3% |
| Standard Deviation (Population) | 14.5% | 12.1% |
Similar Demographics by College, Under 1 year
Demographics Similar to Spaniards by College, Under 1 year
In terms of college, under 1 year, the demographic groups most similar to Spaniards are Dutch (65.3%, a difference of 0.030%), Immigrants from Africa (65.3%, a difference of 0.040%), German Russian (65.4%, a difference of 0.12%), Guamanian/Chamorro (65.4%, a difference of 0.12%), and Immigrants from Poland (65.2%, a difference of 0.13%).
| Demographics | Rating | Rank | College, Under 1 year |
| Immigrants | Bosnia and Herzegovina | 50.0 /100 | #174 | Average 65.4% |
| Scotch-Irish | 49.5 /100 | #175 | Average 65.4% |
| French | 48.9 /100 | #176 | Average 65.4% |
| Immigrants | North Macedonia | 48.6 /100 | #177 | Average 65.4% |
| German Russians | 48.3 /100 | #178 | Average 65.4% |
| Guamanians/Chamorros | 48.2 /100 | #179 | Average 65.4% |
| Dutch | 46.1 /100 | #180 | Average 65.3% |
| Spaniards | 45.5 /100 | #181 | Average 65.3% |
| Immigrants | Africa | 44.7 /100 | #182 | Average 65.3% |
| Immigrants | Poland | 42.6 /100 | #183 | Average 65.2% |
| Bermudans | 42.0 /100 | #184 | Average 65.2% |
| Sri Lankans | 41.7 /100 | #185 | Average 65.2% |
| Immigrants | Sierra Leone | 39.7 /100 | #186 | Fair 65.1% |
| Immigrants | Southern Europe | 34.3 /100 | #187 | Fair 64.9% |
| Immigrants | Albania | 32.0 /100 | #188 | Fair 64.9% |
Demographics Similar to Taiwanese by College, Under 1 year
In terms of college, under 1 year, the demographic groups most similar to Taiwanese are Immigrants from Venezuela (66.3%, a difference of 0.040%), Immigrants from Iraq (66.3%, a difference of 0.090%), Immigrants from Sudan (66.2%, a difference of 0.16%), Kenyan (66.5%, a difference of 0.21%), and Immigrants from Morocco (66.5%, a difference of 0.21%).
| Demographics | Rating | Rank | College, Under 1 year |
| Immigrants | Afghanistan | 85.1 /100 | #141 | Excellent 66.7% |
| English | 82.9 /100 | #142 | Excellent 66.6% |
| Immigrants | Uganda | 82.8 /100 | #143 | Excellent 66.5% |
| Immigrants | Germany | 82.0 /100 | #144 | Excellent 66.5% |
| Immigrants | Kenya | 81.8 /100 | #145 | Excellent 66.5% |
| Kenyans | 81.7 /100 | #146 | Excellent 66.5% |
| Immigrants | Morocco | 81.7 /100 | #147 | Excellent 66.5% |
| Taiwanese | 78.6 /100 | #148 | Good 66.4% |
| Immigrants | Venezuela | 77.9 /100 | #149 | Good 66.3% |
| Immigrants | Iraq | 77.1 /100 | #150 | Good 66.3% |
| Immigrants | Sudan | 76.0 /100 | #151 | Good 66.2% |
| Sudanese | 74.1 /100 | #152 | Good 66.2% |
| Belgians | 73.7 /100 | #153 | Good 66.2% |
| Immigrants | Eritrea | 71.9 /100 | #154 | Good 66.1% |
| Irish | 70.3 /100 | #155 | Good 66.0% |