Spaniard vs Ethiopian GED/Equivalency
COMPARE
Spaniard
Ethiopian
GED/Equivalency
GED/Equivalency Comparison
Spaniards
Ethiopians
85.4%
GED/EQUIVALENCY
31.9/ 100
METRIC RATING
186th/ 347
METRIC RANK
86.0%
GED/EQUIVALENCY
63.7/ 100
METRIC RATING
167th/ 347
METRIC RANK
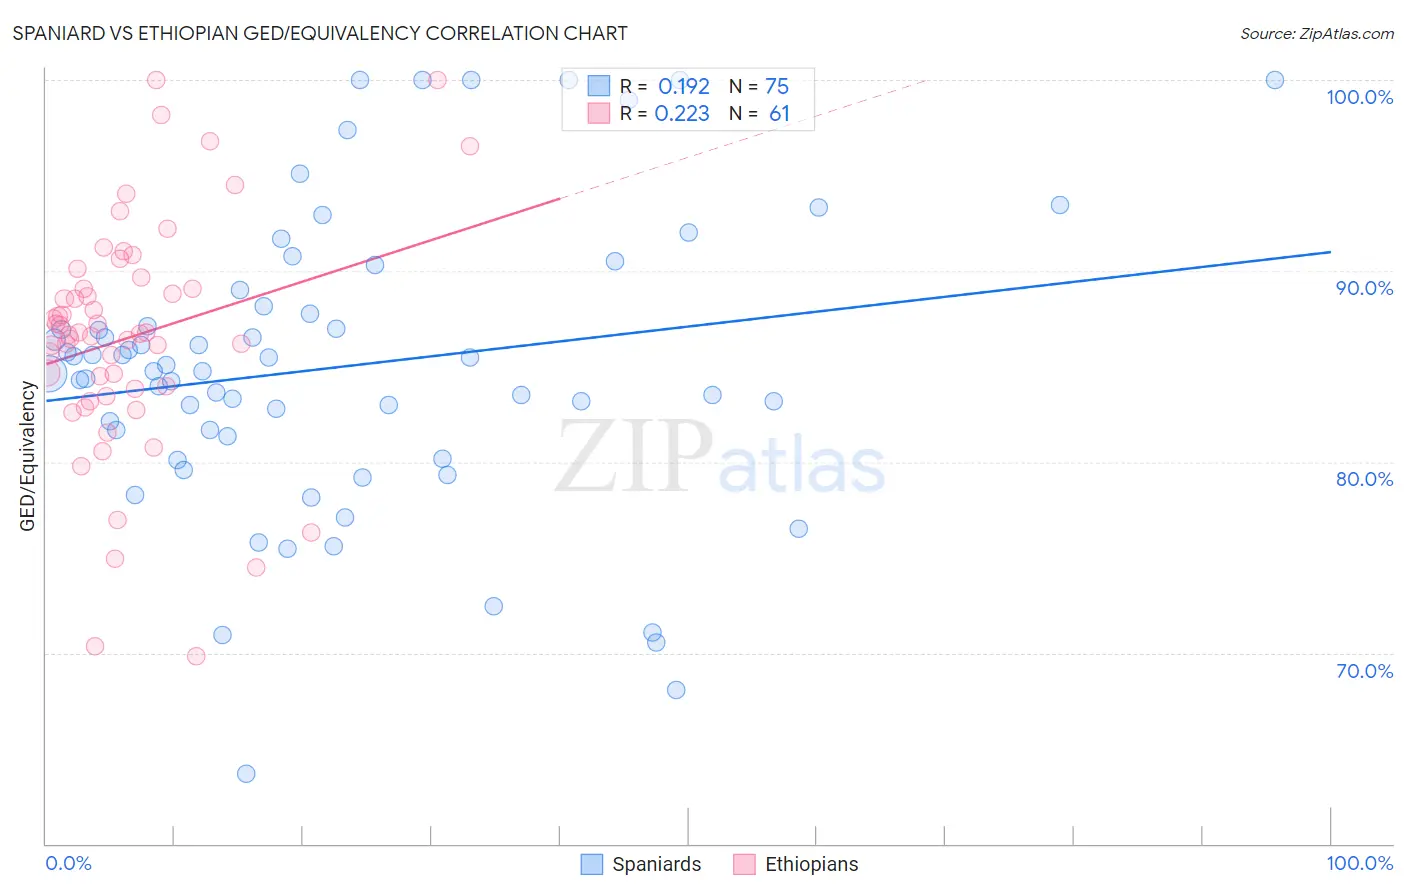
Spaniard vs Ethiopian GED/Equivalency Correlation Chart
The statistical analysis conducted on geographies consisting of 443,545,703 people shows a poor positive correlation between the proportion of Spaniards and percentage of population with at least ged/equivalency education in the United States with a correlation coefficient (R) of 0.192 and weighted average of 85.4%. Similarly, the statistical analysis conducted on geographies consisting of 223,262,051 people shows a weak positive correlation between the proportion of Ethiopians and percentage of population with at least ged/equivalency education in the United States with a correlation coefficient (R) of 0.223 and weighted average of 86.0%, a difference of 0.68%.
GED/Equivalency Correlation Summary
| Measurement | Spaniard | Ethiopian |
| Minimum | 63.6% | 69.8% |
| Maximum | 100.0% | 100.0% |
| Range | 36.4% | 30.2% |
| Mean | 85.0% | 86.5% |
| Median | 84.7% | 86.7% |
| Interquartile 25% (IQ1) | 81.4% | 83.6% |
| Interquartile 75% (IQ3) | 88.2% | 89.4% |
| Interquartile Range (IQR) | 6.8% | 5.7% |
| Standard Deviation (Sample) | 7.8% | 6.2% |
| Standard Deviation (Population) | 7.7% | 6.1% |
Demographics Similar to Spaniards and Ethiopians by GED/Equivalency
In terms of ged/equivalency, the demographic groups most similar to Spaniards are Spanish (85.4%, a difference of 0.020%), Immigrants from Oceania (85.5%, a difference of 0.040%), Immigrants from Sudan (85.5%, a difference of 0.050%), Sudanese (85.5%, a difference of 0.070%), and Moroccan (85.5%, a difference of 0.13%). Similarly, the demographic groups most similar to Ethiopians are Immigrants from Albania (86.0%, a difference of 0.010%), Sierra Leonean (86.0%, a difference of 0.040%), Immigrants from Ethiopia (86.0%, a difference of 0.050%), Afghan (85.9%, a difference of 0.090%), and Immigrants from Chile (85.9%, a difference of 0.14%).
| Demographics | Rating | Rank | GED/Equivalency |
| Immigrants | Albania | 64.2 /100 | #166 | Good 86.0% |
| Ethiopians | 63.7 /100 | #167 | Good 86.0% |
| Sierra Leoneans | 61.8 /100 | #168 | Good 86.0% |
| Immigrants | Ethiopia | 61.2 /100 | #169 | Good 86.0% |
| Afghans | 59.7 /100 | #170 | Average 85.9% |
| Immigrants | Chile | 57.3 /100 | #171 | Average 85.9% |
| Bermudans | 55.1 /100 | #172 | Average 85.8% |
| Immigrants | Venezuela | 50.7 /100 | #173 | Average 85.8% |
| Ottawa | 50.0 /100 | #174 | Average 85.8% |
| Immigrants | Bolivia | 49.8 /100 | #175 | Average 85.8% |
| Immigrants | Eastern Africa | 47.7 /100 | #176 | Average 85.7% |
| Immigrants | Uganda | 45.2 /100 | #177 | Average 85.7% |
| Koreans | 41.2 /100 | #178 | Average 85.6% |
| Aleuts | 40.5 /100 | #179 | Average 85.6% |
| Immigrants | Southern Europe | 38.4 /100 | #180 | Fair 85.5% |
| Moroccans | 37.7 /100 | #181 | Fair 85.5% |
| Sudanese | 35.2 /100 | #182 | Fair 85.5% |
| Immigrants | Sudan | 34.2 /100 | #183 | Fair 85.5% |
| Immigrants | Oceania | 33.6 /100 | #184 | Fair 85.5% |
| Spanish | 32.8 /100 | #185 | Fair 85.4% |
| Spaniards | 31.9 /100 | #186 | Fair 85.4% |