Immigrants from Bangladesh vs Immigrants from El Salvador Master's Degree
COMPARE
Immigrants from Bangladesh
Immigrants from El Salvador
Master's Degree
Master's Degree Comparison
Immigrants from Bangladesh
Immigrants from El Salvador
15.5%
MASTER'S DEGREE
76.1/ 100
METRIC RATING
155th/ 347
METRIC RANK
12.0%
MASTER'S DEGREE
0.2/ 100
METRIC RATING
282nd/ 347
METRIC RANK
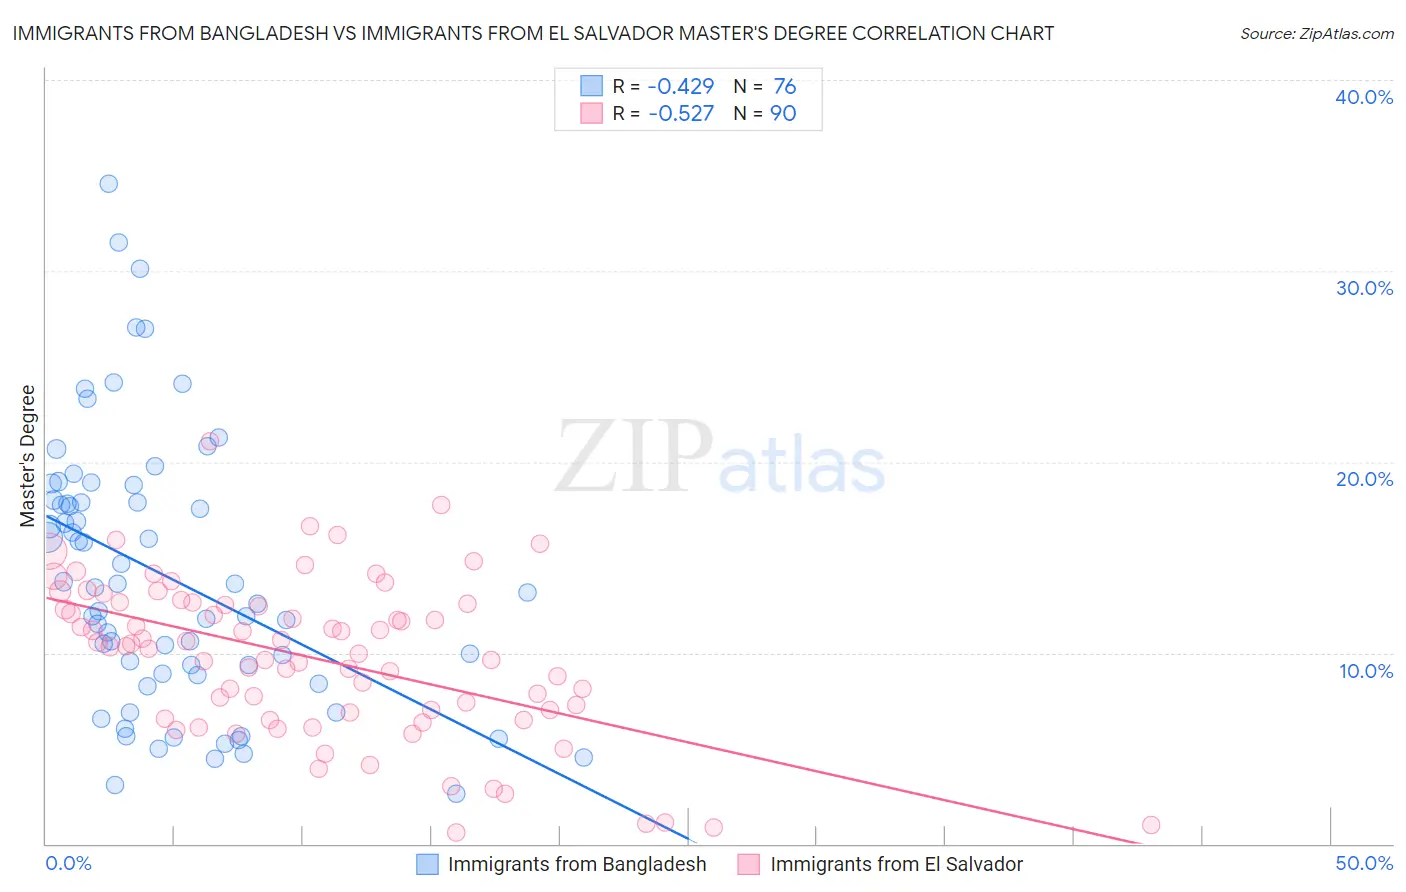
Immigrants from Bangladesh vs Immigrants from El Salvador Master's Degree Correlation Chart
The statistical analysis conducted on geographies consisting of 203,660,853 people shows a moderate negative correlation between the proportion of Immigrants from Bangladesh and percentage of population with at least master's degree education in the United States with a correlation coefficient (R) of -0.429 and weighted average of 15.5%. Similarly, the statistical analysis conducted on geographies consisting of 357,699,051 people shows a substantial negative correlation between the proportion of Immigrants from El Salvador and percentage of population with at least master's degree education in the United States with a correlation coefficient (R) of -0.527 and weighted average of 12.0%, a difference of 29.0%.
Master's Degree Correlation Summary
| Measurement | Immigrants from Bangladesh | Immigrants from El Salvador |
| Minimum | 2.6% | 0.61% |
| Maximum | 34.6% | 21.1% |
| Range | 31.9% | 20.5% |
| Mean | 14.0% | 9.7% |
| Median | 13.3% | 10.3% |
| Interquartile 25% (IQ1) | 8.9% | 6.8% |
| Interquartile 75% (IQ3) | 17.9% | 12.5% |
| Interquartile Range (IQR) | 9.1% | 5.7% |
| Standard Deviation (Sample) | 7.0% | 4.1% |
| Standard Deviation (Population) | 7.0% | 4.1% |
Similar Demographics by Master's Degree
Demographics Similar to Immigrants from Bangladesh by Master's Degree
In terms of master's degree, the demographic groups most similar to Immigrants from Bangladesh are Immigrants from South America (15.5%, a difference of 0.040%), Icelander (15.5%, a difference of 0.13%), Slavic (15.5%, a difference of 0.16%), Iraqi (15.5%, a difference of 0.21%), and Slovene (15.5%, a difference of 0.33%).
| Demographics | Rating | Rank | Master's Degree |
| Immigrants | Senegal | 78.2 /100 | #148 | Good 15.5% |
| Ghanaians | 78.2 /100 | #149 | Good 15.5% |
| Slovenes | 78.0 /100 | #150 | Good 15.5% |
| Iraqis | 77.3 /100 | #151 | Good 15.5% |
| Slavs | 77.0 /100 | #152 | Good 15.5% |
| Icelanders | 76.8 /100 | #153 | Good 15.5% |
| Immigrants | South America | 76.3 /100 | #154 | Good 15.5% |
| Immigrants | Bangladesh | 76.1 /100 | #155 | Good 15.5% |
| Bermudans | 73.9 /100 | #156 | Good 15.4% |
| Immigrants | Cameroon | 71.7 /100 | #157 | Good 15.4% |
| Immigrants | Poland | 71.5 /100 | #158 | Good 15.4% |
| Luxembourgers | 71.0 /100 | #159 | Good 15.3% |
| Kenyans | 70.3 /100 | #160 | Good 15.3% |
| Sudanese | 68.7 /100 | #161 | Good 15.3% |
| Peruvians | 68.7 /100 | #162 | Good 15.3% |
Demographics Similar to Immigrants from El Salvador by Master's Degree
In terms of master's degree, the demographic groups most similar to Immigrants from El Salvador are Malaysian (12.0%, a difference of 0.31%), Honduran (11.9%, a difference of 0.41%), Immigrants from Dominican Republic (12.1%, a difference of 0.44%), Immigrants from Belize (12.1%, a difference of 0.49%), and Potawatomi (12.1%, a difference of 0.57%).
| Demographics | Rating | Rank | Master's Degree |
| Cubans | 0.3 /100 | #275 | Tragic 12.1% |
| Blacks/African Americans | 0.3 /100 | #276 | Tragic 12.1% |
| Immigrants | Caribbean | 0.3 /100 | #277 | Tragic 12.1% |
| Potawatomi | 0.3 /100 | #278 | Tragic 12.1% |
| Immigrants | Belize | 0.2 /100 | #279 | Tragic 12.1% |
| Immigrants | Dominican Republic | 0.2 /100 | #280 | Tragic 12.1% |
| Malaysians | 0.2 /100 | #281 | Tragic 12.0% |
| Immigrants | El Salvador | 0.2 /100 | #282 | Tragic 12.0% |
| Hondurans | 0.2 /100 | #283 | Tragic 11.9% |
| Ottawa | 0.2 /100 | #284 | Tragic 11.9% |
| Immigrants | Nicaragua | 0.2 /100 | #285 | Tragic 11.8% |
| Aleuts | 0.1 /100 | #286 | Tragic 11.8% |
| Immigrants | Haiti | 0.1 /100 | #287 | Tragic 11.8% |
| Immigrants | Honduras | 0.1 /100 | #288 | Tragic 11.8% |
| Guatemalans | 0.1 /100 | #289 | Tragic 11.7% |