Spaniard vs Immigrants from El Salvador Ambulatory Disability
COMPARE
Spaniard
Immigrants from El Salvador
Ambulatory Disability
Ambulatory Disability Comparison
Spaniards
Immigrants from El Salvador
6.5%
AMBULATORY DISABILITY
1.6/ 100
METRIC RATING
242nd/ 347
METRIC RANK
5.8%
AMBULATORY DISABILITY
98.4/ 100
METRIC RATING
95th/ 347
METRIC RANK
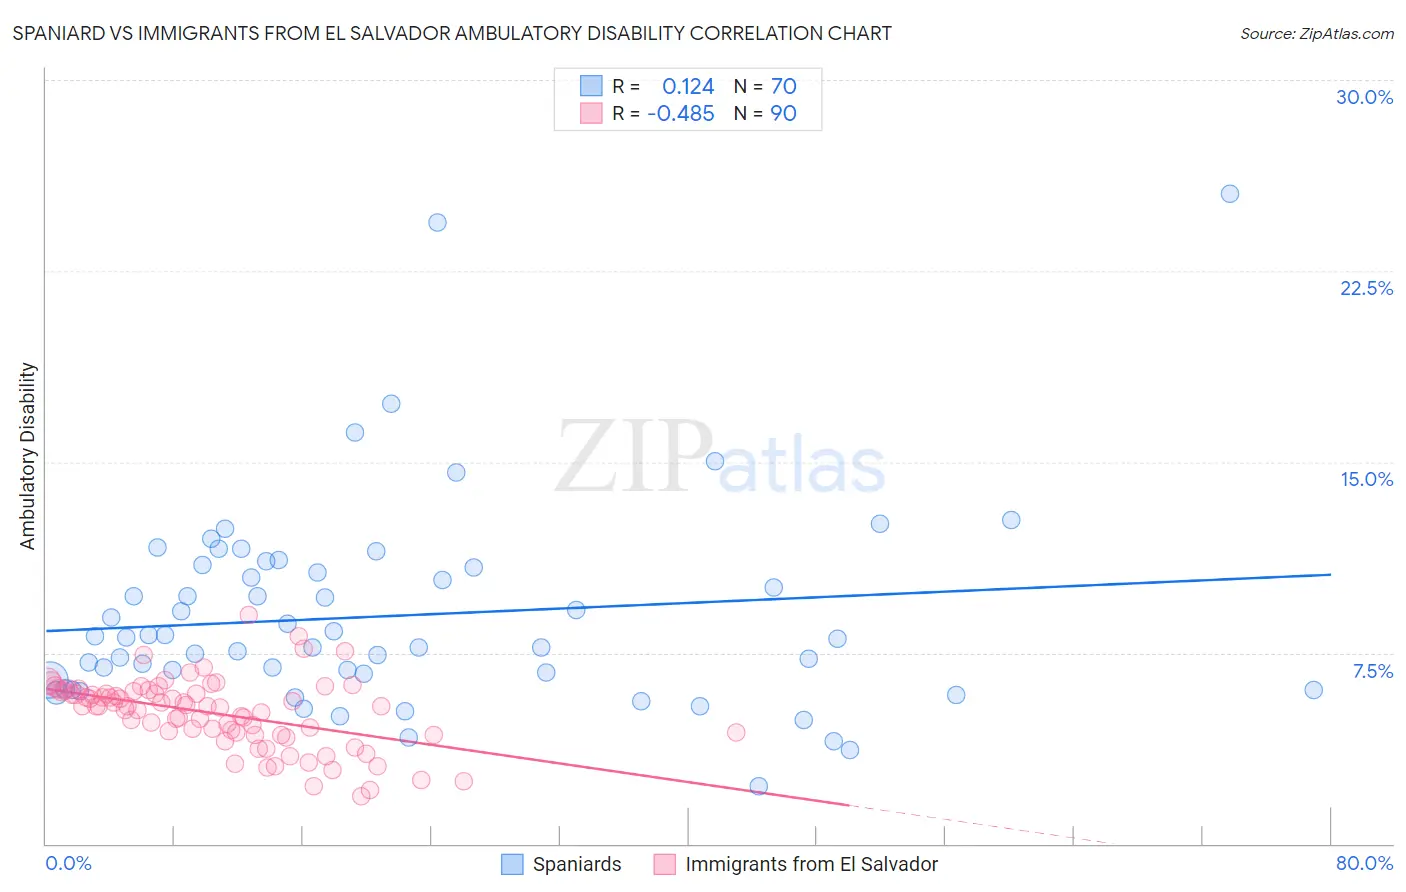
Spaniard vs Immigrants from El Salvador Ambulatory Disability Correlation Chart
The statistical analysis conducted on geographies consisting of 443,300,484 people shows a poor positive correlation between the proportion of Spaniards and percentage of population with ambulatory disability in the United States with a correlation coefficient (R) of 0.124 and weighted average of 6.5%. Similarly, the statistical analysis conducted on geographies consisting of 357,732,482 people shows a moderate negative correlation between the proportion of Immigrants from El Salvador and percentage of population with ambulatory disability in the United States with a correlation coefficient (R) of -0.485 and weighted average of 5.8%, a difference of 11.6%.
Ambulatory Disability Correlation Summary
| Measurement | Spaniard | Immigrants from El Salvador |
| Minimum | 2.3% | 1.9% |
| Maximum | 25.6% | 9.0% |
| Range | 23.3% | 7.1% |
| Mean | 9.0% | 5.1% |
| Median | 8.1% | 5.4% |
| Interquartile 25% (IQ1) | 6.4% | 4.4% |
| Interquartile 75% (IQ3) | 10.9% | 6.0% |
| Interquartile Range (IQR) | 4.4% | 1.6% |
| Standard Deviation (Sample) | 4.1% | 1.4% |
| Standard Deviation (Population) | 4.0% | 1.4% |
Similar Demographics by Ambulatory Disability
Demographics Similar to Spaniards by Ambulatory Disability
In terms of ambulatory disability, the demographic groups most similar to Spaniards are German (6.5%, a difference of 0.020%), Immigrants from Panama (6.5%, a difference of 0.020%), Immigrants from Haiti (6.5%, a difference of 0.030%), Tlingit-Haida (6.5%, a difference of 0.060%), and Armenian (6.5%, a difference of 0.070%).
| Demographics | Rating | Rank | Ambulatory Disability |
| Hispanics or Latinos | 2.2 /100 | #235 | Tragic 6.4% |
| Dutch | 2.0 /100 | #236 | Tragic 6.4% |
| Immigrants | Germany | 1.8 /100 | #237 | Tragic 6.4% |
| Haitians | 1.8 /100 | #238 | Tragic 6.4% |
| Senegalese | 1.7 /100 | #239 | Tragic 6.4% |
| Immigrants | Senegal | 1.7 /100 | #240 | Tragic 6.4% |
| Immigrants | Haiti | 1.6 /100 | #241 | Tragic 6.5% |
| Spaniards | 1.6 /100 | #242 | Tragic 6.5% |
| Germans | 1.5 /100 | #243 | Tragic 6.5% |
| Immigrants | Panama | 1.5 /100 | #244 | Tragic 6.5% |
| Tlingit-Haida | 1.5 /100 | #245 | Tragic 6.5% |
| Armenians | 1.5 /100 | #246 | Tragic 6.5% |
| Immigrants | Cuba | 1.4 /100 | #247 | Tragic 6.5% |
| Immigrants | Portugal | 1.4 /100 | #248 | Tragic 6.5% |
| Native Hawaiians | 1.1 /100 | #249 | Tragic 6.5% |
Demographics Similar to Immigrants from El Salvador by Ambulatory Disability
In terms of ambulatory disability, the demographic groups most similar to Immigrants from El Salvador are Salvadoran (5.8%, a difference of 0.020%), Kenyan (5.8%, a difference of 0.040%), Immigrants from Somalia (5.8%, a difference of 0.060%), Immigrants from Lebanon (5.8%, a difference of 0.090%), and Immigrants from Northern Europe (5.8%, a difference of 0.17%).
| Demographics | Rating | Rank | Ambulatory Disability |
| Soviet Union | 98.9 /100 | #88 | Exceptional 5.8% |
| Bhutanese | 98.8 /100 | #89 | Exceptional 5.8% |
| Australians | 98.8 /100 | #90 | Exceptional 5.8% |
| Immigrants | Sudan | 98.8 /100 | #91 | Exceptional 5.8% |
| Immigrants | Sierra Leone | 98.6 /100 | #92 | Exceptional 5.8% |
| Immigrants | Denmark | 98.6 /100 | #93 | Exceptional 5.8% |
| Kenyans | 98.4 /100 | #94 | Exceptional 5.8% |
| Immigrants | El Salvador | 98.4 /100 | #95 | Exceptional 5.8% |
| Salvadorans | 98.4 /100 | #96 | Exceptional 5.8% |
| Immigrants | Somalia | 98.3 /100 | #97 | Exceptional 5.8% |
| Immigrants | Lebanon | 98.3 /100 | #98 | Exceptional 5.8% |
| Immigrants | Northern Europe | 98.2 /100 | #99 | Exceptional 5.8% |
| Immigrants | Serbia | 97.9 /100 | #100 | Exceptional 5.8% |
| Immigrants | South America | 97.9 /100 | #101 | Exceptional 5.8% |
| Immigrants | Kenya | 97.8 /100 | #102 | Exceptional 5.8% |