Hopi vs Immigrants from El Salvador Master's Degree
COMPARE
Hopi
Immigrants from El Salvador
Master's Degree
Master's Degree Comparison
Hopi
Immigrants from El Salvador
10.9%
MASTER'S DEGREE
0.0/ 100
METRIC RATING
317th/ 347
METRIC RANK
12.0%
MASTER'S DEGREE
0.2/ 100
METRIC RATING
282nd/ 347
METRIC RANK
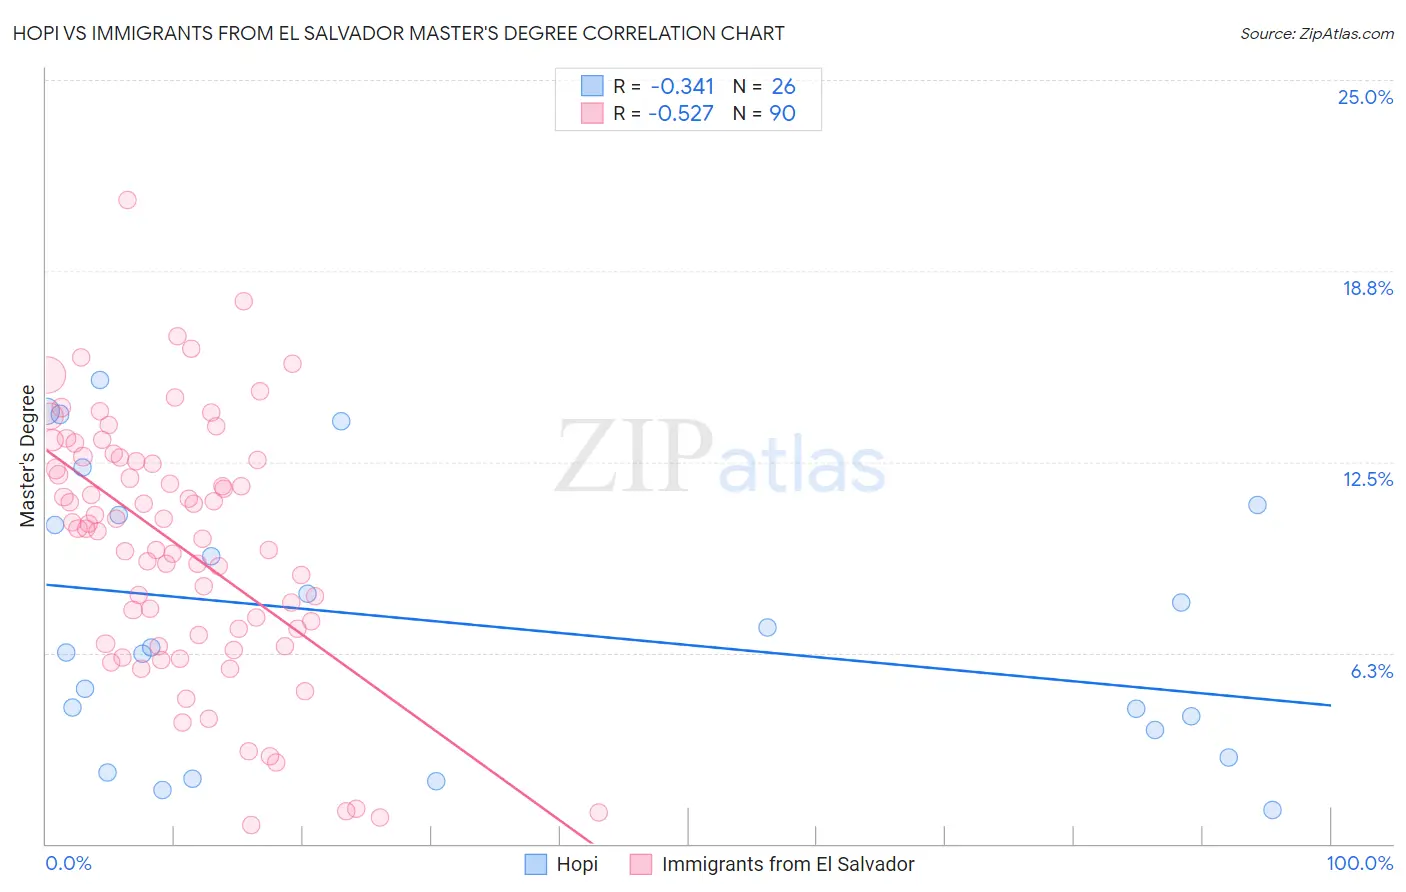
Hopi vs Immigrants from El Salvador Master's Degree Correlation Chart
The statistical analysis conducted on geographies consisting of 74,729,525 people shows a mild negative correlation between the proportion of Hopi and percentage of population with at least master's degree education in the United States with a correlation coefficient (R) of -0.341 and weighted average of 10.9%. Similarly, the statistical analysis conducted on geographies consisting of 357,699,051 people shows a substantial negative correlation between the proportion of Immigrants from El Salvador and percentage of population with at least master's degree education in the United States with a correlation coefficient (R) of -0.527 and weighted average of 12.0%, a difference of 10.4%.
Master's Degree Correlation Summary
| Measurement | Hopi | Immigrants from El Salvador |
| Minimum | 1.1% | 0.61% |
| Maximum | 15.2% | 21.1% |
| Range | 14.1% | 20.5% |
| Mean | 7.2% | 9.7% |
| Median | 6.3% | 10.3% |
| Interquartile 25% (IQ1) | 3.7% | 6.8% |
| Interquartile 75% (IQ3) | 10.8% | 12.5% |
| Interquartile Range (IQR) | 7.0% | 5.7% |
| Standard Deviation (Sample) | 4.4% | 4.1% |
| Standard Deviation (Population) | 4.3% | 4.1% |
Similar Demographics by Master's Degree
Demographics Similar to Hopi by Master's Degree
In terms of master's degree, the demographic groups most similar to Hopi are Immigrants from Cuba (10.9%, a difference of 0.13%), Kiowa (10.8%, a difference of 0.37%), Hispanic or Latino (10.9%, a difference of 0.54%), Cajun (11.0%, a difference of 0.88%), and Apache (11.0%, a difference of 0.88%).
| Demographics | Rating | Rank | Master's Degree |
| Shoshone | 0.0 /100 | #310 | Tragic 11.1% |
| Seminole | 0.0 /100 | #311 | Tragic 11.0% |
| Choctaw | 0.0 /100 | #312 | Tragic 11.0% |
| Yaqui | 0.0 /100 | #313 | Tragic 11.0% |
| Cajuns | 0.0 /100 | #314 | Tragic 11.0% |
| Apache | 0.0 /100 | #315 | Tragic 11.0% |
| Hispanics or Latinos | 0.0 /100 | #316 | Tragic 10.9% |
| Hopi | 0.0 /100 | #317 | Tragic 10.9% |
| Immigrants | Cuba | 0.0 /100 | #318 | Tragic 10.9% |
| Kiowa | 0.0 /100 | #319 | Tragic 10.8% |
| Immigrants | Micronesia | 0.0 /100 | #320 | Tragic 10.8% |
| Pennsylvania Germans | 0.0 /100 | #321 | Tragic 10.7% |
| Sioux | 0.0 /100 | #322 | Tragic 10.7% |
| Crow | 0.0 /100 | #323 | Tragic 10.6% |
| Dutch West Indians | 0.0 /100 | #324 | Tragic 10.6% |
Demographics Similar to Immigrants from El Salvador by Master's Degree
In terms of master's degree, the demographic groups most similar to Immigrants from El Salvador are Malaysian (12.0%, a difference of 0.31%), Honduran (11.9%, a difference of 0.41%), Immigrants from Dominican Republic (12.1%, a difference of 0.44%), Immigrants from Belize (12.1%, a difference of 0.49%), and Potawatomi (12.1%, a difference of 0.57%).
| Demographics | Rating | Rank | Master's Degree |
| Cubans | 0.3 /100 | #275 | Tragic 12.1% |
| Blacks/African Americans | 0.3 /100 | #276 | Tragic 12.1% |
| Immigrants | Caribbean | 0.3 /100 | #277 | Tragic 12.1% |
| Potawatomi | 0.3 /100 | #278 | Tragic 12.1% |
| Immigrants | Belize | 0.2 /100 | #279 | Tragic 12.1% |
| Immigrants | Dominican Republic | 0.2 /100 | #280 | Tragic 12.1% |
| Malaysians | 0.2 /100 | #281 | Tragic 12.0% |
| Immigrants | El Salvador | 0.2 /100 | #282 | Tragic 12.0% |
| Hondurans | 0.2 /100 | #283 | Tragic 11.9% |
| Ottawa | 0.2 /100 | #284 | Tragic 11.9% |
| Immigrants | Nicaragua | 0.2 /100 | #285 | Tragic 11.8% |
| Aleuts | 0.1 /100 | #286 | Tragic 11.8% |
| Immigrants | Haiti | 0.1 /100 | #287 | Tragic 11.8% |
| Immigrants | Honduras | 0.1 /100 | #288 | Tragic 11.8% |
| Guatemalans | 0.1 /100 | #289 | Tragic 11.7% |