Spaniard vs Immigrants from El Salvador 12th Grade, No Diploma
COMPARE
Spaniard
Immigrants from El Salvador
12th Grade, No Diploma
12th Grade, No Diploma Comparison
Spaniards
Immigrants from El Salvador
91.0%
12TH GRADE, NO DIPLOMA
36.2/ 100
METRIC RATING
184th/ 347
METRIC RANK
83.6%
12TH GRADE, NO DIPLOMA
0.0/ 100
METRIC RATING
343rd/ 347
METRIC RANK
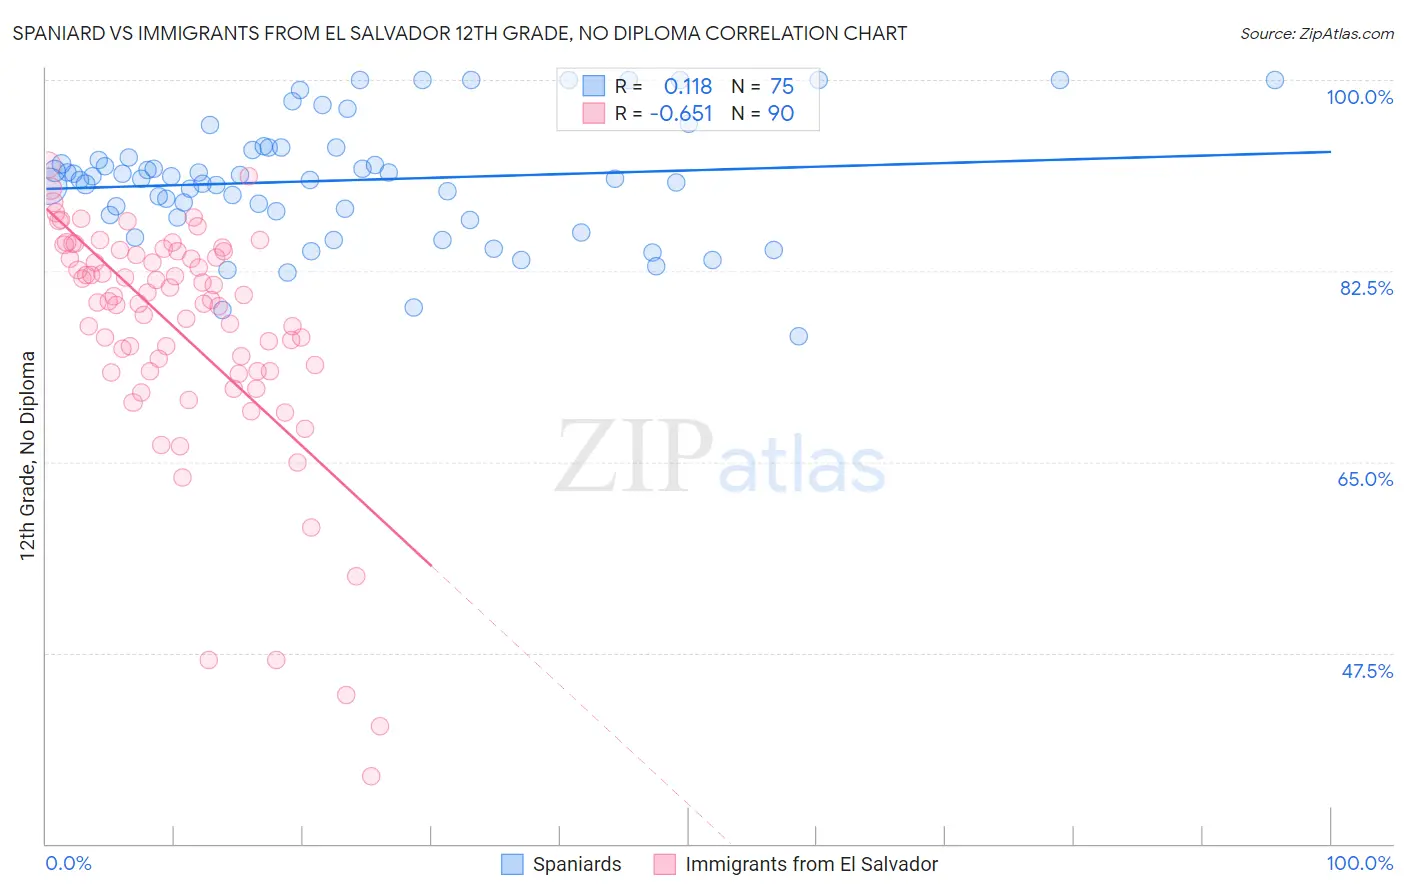
Spaniard vs Immigrants from El Salvador 12th Grade, No Diploma Correlation Chart
The statistical analysis conducted on geographies consisting of 443,544,054 people shows a poor positive correlation between the proportion of Spaniards and percentage of population with at least 12th grade (no diploma) education in the United States with a correlation coefficient (R) of 0.118 and weighted average of 91.0%. Similarly, the statistical analysis conducted on geographies consisting of 357,852,938 people shows a significant negative correlation between the proportion of Immigrants from El Salvador and percentage of population with at least 12th grade (no diploma) education in the United States with a correlation coefficient (R) of -0.651 and weighted average of 83.6%, a difference of 8.9%.
12th Grade, No Diploma Correlation Summary
| Measurement | Spaniard | Immigrants from El Salvador |
| Minimum | 76.5% | 36.2% |
| Maximum | 100.0% | 92.2% |
| Range | 23.5% | 56.0% |
| Mean | 90.8% | 77.1% |
| Median | 91.0% | 79.8% |
| Interquartile 25% (IQ1) | 87.6% | 73.3% |
| Interquartile 75% (IQ3) | 93.8% | 84.3% |
| Interquartile Range (IQR) | 6.2% | 11.0% |
| Standard Deviation (Sample) | 5.5% | 10.9% |
| Standard Deviation (Population) | 5.5% | 10.9% |
Similar Demographics by 12th Grade, No Diploma
Demographics Similar to Spaniards by 12th Grade, No Diploma
In terms of 12th grade, no diploma, the demographic groups most similar to Spaniards are Sudanese (91.0%, a difference of 0.020%), Nonimmigrants (91.0%, a difference of 0.030%), Osage (91.0%, a difference of 0.030%), Ethiopian (91.0%, a difference of 0.030%), and Guamanian/Chamorro (91.0%, a difference of 0.040%).
| Demographics | Rating | Rank | 12th Grade, No Diploma |
| Sierra Leoneans | 47.7 /100 | #177 | Average 91.1% |
| Spanish | 43.7 /100 | #178 | Average 91.1% |
| Immigrants | Chile | 43.3 /100 | #179 | Average 91.1% |
| Immigrants | Syria | 40.3 /100 | #180 | Average 91.1% |
| Guamanians/Chamorros | 39.5 /100 | #181 | Fair 91.0% |
| Immigrants | Nonimmigrants | 38.8 /100 | #182 | Fair 91.0% |
| Osage | 38.3 /100 | #183 | Fair 91.0% |
| Spaniards | 36.2 /100 | #184 | Fair 91.0% |
| Sudanese | 34.4 /100 | #185 | Fair 91.0% |
| Ethiopians | 33.9 /100 | #186 | Fair 91.0% |
| Potawatomi | 32.9 /100 | #187 | Fair 91.0% |
| Americans | 32.6 /100 | #188 | Fair 91.0% |
| Immigrants | Uganda | 31.6 /100 | #189 | Fair 90.9% |
| Afghans | 29.9 /100 | #190 | Fair 90.9% |
| Moroccans | 28.8 /100 | #191 | Fair 90.9% |
Demographics Similar to Immigrants from El Salvador by 12th Grade, No Diploma
In terms of 12th grade, no diploma, the demographic groups most similar to Immigrants from El Salvador are Houma (83.7%, a difference of 0.16%), Immigrants from Guatemala (84.0%, a difference of 0.51%), Mexican (84.1%, a difference of 0.65%), Immigrants from Central America (83.0%, a difference of 0.74%), and Spanish American Indian (82.9%, a difference of 0.80%).
| Demographics | Rating | Rank | 12th Grade, No Diploma |
| Immigrants | Latin America | 0.0 /100 | #333 | Tragic 85.0% |
| Immigrants | Dominican Republic | 0.0 /100 | #334 | Tragic 84.9% |
| Immigrants | Yemen | 0.0 /100 | #335 | Tragic 84.8% |
| Tohono O'odham | 0.0 /100 | #336 | Tragic 84.7% |
| Pima | 0.0 /100 | #337 | Tragic 84.6% |
| Guatemalans | 0.0 /100 | #338 | Tragic 84.6% |
| Salvadorans | 0.0 /100 | #339 | Tragic 84.5% |
| Mexicans | 0.0 /100 | #340 | Tragic 84.1% |
| Immigrants | Guatemala | 0.0 /100 | #341 | Tragic 84.0% |
| Houma | 0.0 /100 | #342 | Tragic 83.7% |
| Immigrants | El Salvador | 0.0 /100 | #343 | Tragic 83.6% |
| Immigrants | Central America | 0.0 /100 | #344 | Tragic 83.0% |
| Spanish American Indians | 0.0 /100 | #345 | Tragic 82.9% |
| Yakama | 0.0 /100 | #346 | Tragic 82.5% |
| Immigrants | Mexico | 0.0 /100 | #347 | Tragic 82.4% |