Spaniard vs Immigrants from El Salvador Child Poverty Among Boys Under 16
COMPARE
Spaniard
Immigrants from El Salvador
Child Poverty Among Boys Under 16
Child Poverty Among Boys Under 16 Comparison
Spaniards
Immigrants from El Salvador
17.1%
CHILD POVERTY AMONG BOYS UNDER 16
20.5/ 100
METRIC RATING
196th/ 347
METRIC RANK
19.6%
CHILD POVERTY AMONG BOYS UNDER 16
0.1/ 100
METRIC RATING
266th/ 347
METRIC RANK
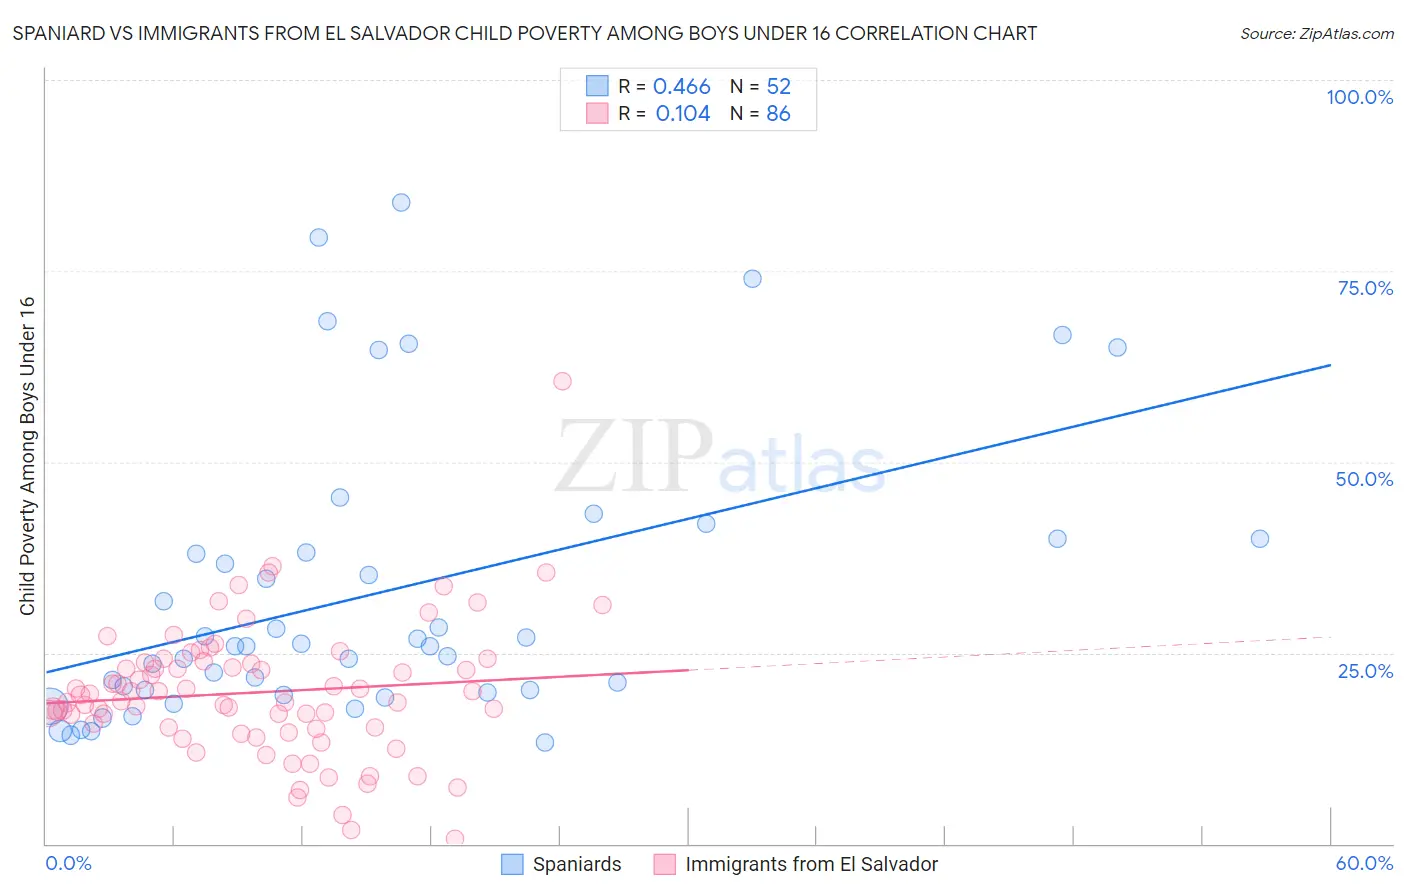
Spaniard vs Immigrants from El Salvador Child Poverty Among Boys Under 16 Correlation Chart
The statistical analysis conducted on geographies consisting of 435,078,567 people shows a moderate positive correlation between the proportion of Spaniards and poverty level among boys under the age of 16 in the United States with a correlation coefficient (R) of 0.466 and weighted average of 17.1%. Similarly, the statistical analysis conducted on geographies consisting of 354,572,517 people shows a poor positive correlation between the proportion of Immigrants from El Salvador and poverty level among boys under the age of 16 in the United States with a correlation coefficient (R) of 0.104 and weighted average of 19.6%, a difference of 14.9%.
Child Poverty Among Boys Under 16 Correlation Summary
| Measurement | Spaniard | Immigrants from El Salvador |
| Minimum | 13.2% | 0.59% |
| Maximum | 83.9% | 60.6% |
| Range | 70.7% | 60.0% |
| Mean | 32.6% | 19.8% |
| Median | 25.9% | 19.1% |
| Interquartile 25% (IQ1) | 19.9% | 15.2% |
| Interquartile 75% (IQ3) | 39.1% | 23.7% |
| Interquartile Range (IQR) | 19.2% | 8.4% |
| Standard Deviation (Sample) | 18.6% | 8.8% |
| Standard Deviation (Population) | 18.4% | 8.7% |
Similar Demographics by Child Poverty Among Boys Under 16
Demographics Similar to Spaniards by Child Poverty Among Boys Under 16
In terms of child poverty among boys under 16, the demographic groups most similar to Spaniards are Spanish (17.0%, a difference of 0.040%), Immigrants from Kenya (17.1%, a difference of 0.060%), Immigrants from Lebanon (17.0%, a difference of 0.12%), Immigrants from Uganda (17.0%, a difference of 0.18%), and Immigrants from Iraq (17.0%, a difference of 0.18%).
| Demographics | Rating | Rank | Child Poverty Among Boys Under 16 |
| Immigrants | Morocco | 34.5 /100 | #189 | Fair 16.7% |
| Arabs | 31.1 /100 | #190 | Fair 16.8% |
| Alaska Natives | 29.8 /100 | #191 | Fair 16.8% |
| Immigrants | Uganda | 21.6 /100 | #192 | Fair 17.0% |
| Immigrants | Iraq | 21.6 /100 | #193 | Fair 17.0% |
| Immigrants | Lebanon | 21.2 /100 | #194 | Fair 17.0% |
| Spanish | 20.8 /100 | #195 | Fair 17.0% |
| Spaniards | 20.5 /100 | #196 | Fair 17.1% |
| Immigrants | Kenya | 20.1 /100 | #197 | Fair 17.1% |
| Immigrants | Cameroon | 19.0 /100 | #198 | Poor 17.1% |
| Delaware | 18.8 /100 | #199 | Poor 17.1% |
| Immigrants | Uruguay | 16.9 /100 | #200 | Poor 17.2% |
| Immigrants | Afghanistan | 13.7 /100 | #201 | Poor 17.3% |
| Immigrants | Sierra Leone | 13.4 /100 | #202 | Poor 17.3% |
| Immigrants | Uzbekistan | 13.3 /100 | #203 | Poor 17.3% |
Demographics Similar to Immigrants from El Salvador by Child Poverty Among Boys Under 16
In terms of child poverty among boys under 16, the demographic groups most similar to Immigrants from El Salvador are Vietnamese (19.6%, a difference of 0.010%), Guyanese (19.6%, a difference of 0.040%), Spanish American Indian (19.6%, a difference of 0.12%), Iroquois (19.6%, a difference of 0.14%), and Immigrants from Cabo Verde (19.7%, a difference of 0.29%).
| Demographics | Rating | Rank | Child Poverty Among Boys Under 16 |
| Spanish Americans | 0.2 /100 | #259 | Tragic 19.4% |
| Shoshone | 0.2 /100 | #260 | Tragic 19.4% |
| Immigrants | Ghana | 0.2 /100 | #261 | Tragic 19.4% |
| Immigrants | Guyana | 0.1 /100 | #262 | Tragic 19.5% |
| Ottawa | 0.1 /100 | #263 | Tragic 19.5% |
| Iroquois | 0.1 /100 | #264 | Tragic 19.6% |
| Guyanese | 0.1 /100 | #265 | Tragic 19.6% |
| Immigrants | El Salvador | 0.1 /100 | #266 | Tragic 19.6% |
| Vietnamese | 0.1 /100 | #267 | Tragic 19.6% |
| Spanish American Indians | 0.1 /100 | #268 | Tragic 19.6% |
| Immigrants | Cabo Verde | 0.1 /100 | #269 | Tragic 19.7% |
| Cherokee | 0.1 /100 | #270 | Tragic 19.7% |
| Chickasaw | 0.1 /100 | #271 | Tragic 19.8% |
| Immigrants | Ecuador | 0.1 /100 | #272 | Tragic 19.8% |
| Belizeans | 0.1 /100 | #273 | Tragic 19.9% |