South American vs Alsatian College, 1 year or more
COMPARE
South American
Alsatian
College, 1 year or more
College, 1 year or more Comparison
South Americans
Alsatians
59.0%
COLLEGE, 1 YEAR OR MORE
35.9/ 100
METRIC RATING
185th/ 347
METRIC RANK
61.3%
COLLEGE, 1 YEAR OR MORE
91.3/ 100
METRIC RATING
126th/ 347
METRIC RANK
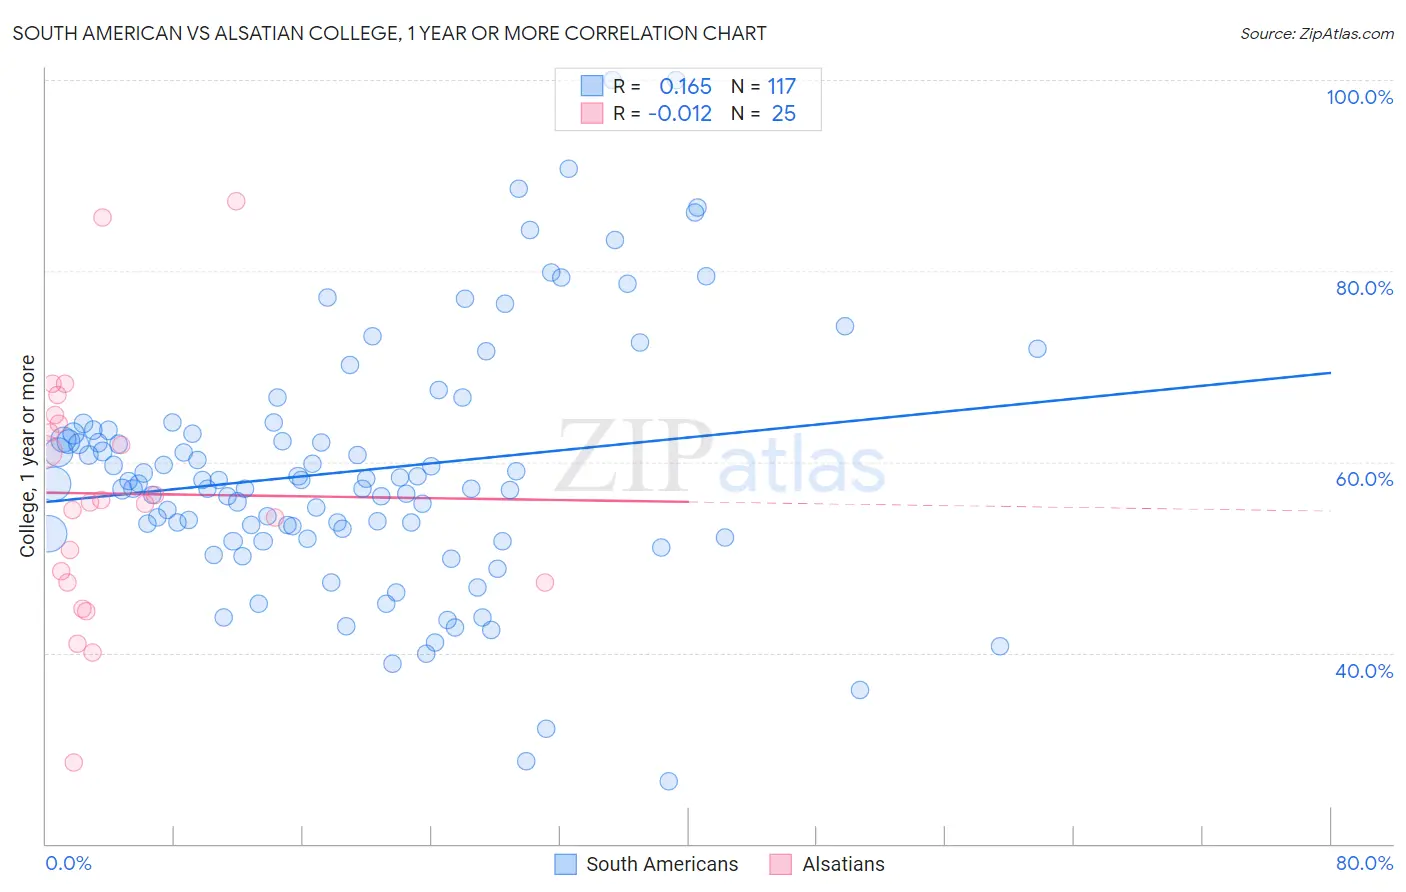
South American vs Alsatian College, 1 year or more Correlation Chart
The statistical analysis conducted on geographies consisting of 494,172,173 people shows a poor positive correlation between the proportion of South Americans and percentage of population with at least college, 1 year or more education in the United States with a correlation coefficient (R) of 0.165 and weighted average of 59.0%. Similarly, the statistical analysis conducted on geographies consisting of 82,682,365 people shows no correlation between the proportion of Alsatians and percentage of population with at least college, 1 year or more education in the United States with a correlation coefficient (R) of -0.012 and weighted average of 61.3%, a difference of 3.9%.
College, 1 year or more Correlation Summary
| Measurement | South American | Alsatian |
| Minimum | 26.5% | 28.5% |
| Maximum | 100.0% | 87.3% |
| Range | 73.5% | 58.8% |
| Mean | 59.1% | 56.7% |
| Median | 57.8% | 55.8% |
| Interquartile 25% (IQ1) | 52.2% | 47.4% |
| Interquartile 75% (IQ3) | 63.1% | 64.4% |
| Interquartile Range (IQR) | 10.9% | 17.1% |
| Standard Deviation (Sample) | 13.2% | 13.3% |
| Standard Deviation (Population) | 13.2% | 13.0% |
Similar Demographics by College, 1 year or more
Demographics Similar to South Americans by College, 1 year or more
In terms of college, 1 year or more, the demographic groups most similar to South Americans are Scotch-Irish (58.9%, a difference of 0.070%), German (58.9%, a difference of 0.070%), French (58.9%, a difference of 0.090%), Spaniard (59.0%, a difference of 0.14%), and German Russian (59.1%, a difference of 0.20%).
| Demographics | Rating | Rank | College, 1 year or more |
| Czechoslovakians | 48.3 /100 | #178 | Average 59.4% |
| Bermudans | 46.6 /100 | #179 | Average 59.3% |
| Yugoslavians | 44.1 /100 | #180 | Average 59.2% |
| Swiss | 43.4 /100 | #181 | Average 59.2% |
| Immigrants | Bosnia and Herzegovina | 42.8 /100 | #182 | Average 59.2% |
| German Russians | 39.3 /100 | #183 | Fair 59.1% |
| Spaniards | 38.3 /100 | #184 | Fair 59.0% |
| South Americans | 35.9 /100 | #185 | Fair 59.0% |
| Scotch-Irish | 34.7 /100 | #186 | Fair 58.9% |
| Germans | 34.7 /100 | #187 | Fair 58.9% |
| French | 34.4 /100 | #188 | Fair 58.9% |
| Uruguayans | 31.8 /100 | #189 | Fair 58.8% |
| Immigrants | Cameroon | 31.2 /100 | #190 | Fair 58.8% |
| Immigrants | Philippines | 29.2 /100 | #191 | Fair 58.7% |
| Colombians | 27.6 /100 | #192 | Fair 58.7% |
Demographics Similar to Alsatians by College, 1 year or more
In terms of college, 1 year or more, the demographic groups most similar to Alsatians are Immigrants from Eastern Africa (61.2%, a difference of 0.030%), Immigrants from Italy (61.2%, a difference of 0.030%), Immigrants from Syria (61.3%, a difference of 0.050%), Ugandan (61.2%, a difference of 0.090%), and Venezuelan (61.3%, a difference of 0.13%).
| Demographics | Rating | Rank | College, 1 year or more |
| Assyrians/Chaldeans/Syriacs | 93.3 /100 | #119 | Exceptional 61.5% |
| Pakistanis | 93.2 /100 | #120 | Exceptional 61.5% |
| Immigrants | Jordan | 92.7 /100 | #121 | Exceptional 61.4% |
| Immigrants | Chile | 92.3 /100 | #122 | Exceptional 61.4% |
| Serbians | 92.2 /100 | #123 | Exceptional 61.4% |
| Venezuelans | 92.1 /100 | #124 | Exceptional 61.3% |
| Immigrants | Syria | 91.6 /100 | #125 | Exceptional 61.3% |
| Alsatians | 91.3 /100 | #126 | Exceptional 61.3% |
| Immigrants | Eastern Africa | 91.1 /100 | #127 | Exceptional 61.2% |
| Immigrants | Italy | 91.1 /100 | #128 | Exceptional 61.2% |
| Ugandans | 90.7 /100 | #129 | Exceptional 61.2% |
| Italians | 89.5 /100 | #130 | Excellent 61.1% |
| Immigrants | Morocco | 89.5 /100 | #131 | Excellent 61.1% |
| Scandinavians | 88.2 /100 | #132 | Excellent 61.0% |
| Immigrants | Uzbekistan | 88.0 /100 | #133 | Excellent 61.0% |