Korean vs Alsatian College, 1 year or more
COMPARE
Korean
Alsatian
College, 1 year or more
College, 1 year or more Comparison
Koreans
Alsatians
59.7%
COLLEGE, 1 YEAR OR MORE
58.5/ 100
METRIC RATING
162nd/ 347
METRIC RANK
61.3%
COLLEGE, 1 YEAR OR MORE
91.3/ 100
METRIC RATING
126th/ 347
METRIC RANK
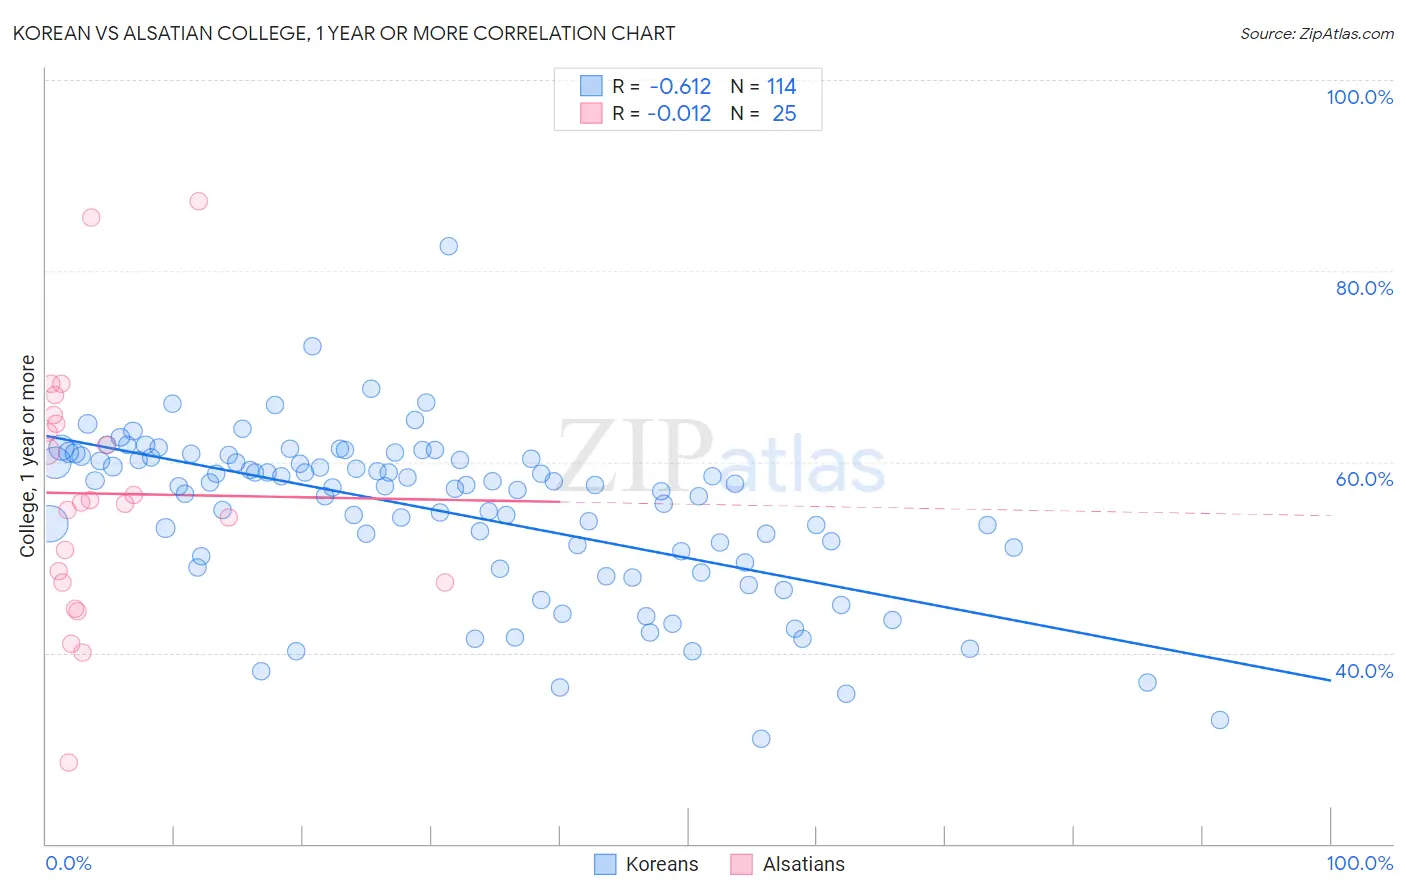
Korean vs Alsatian College, 1 year or more Correlation Chart
The statistical analysis conducted on geographies consisting of 510,942,861 people shows a significant negative correlation between the proportion of Koreans and percentage of population with at least college, 1 year or more education in the United States with a correlation coefficient (R) of -0.612 and weighted average of 59.7%. Similarly, the statistical analysis conducted on geographies consisting of 82,682,365 people shows no correlation between the proportion of Alsatians and percentage of population with at least college, 1 year or more education in the United States with a correlation coefficient (R) of -0.012 and weighted average of 61.3%, a difference of 2.6%.
College, 1 year or more Correlation Summary
| Measurement | Korean | Alsatian |
| Minimum | 31.0% | 28.5% |
| Maximum | 82.6% | 87.3% |
| Range | 51.6% | 58.8% |
| Mean | 54.8% | 56.7% |
| Median | 57.4% | 55.8% |
| Interquartile 25% (IQ1) | 50.1% | 47.4% |
| Interquartile 75% (IQ3) | 60.4% | 64.4% |
| Interquartile Range (IQR) | 10.3% | 17.1% |
| Standard Deviation (Sample) | 8.5% | 13.3% |
| Standard Deviation (Population) | 8.5% | 13.0% |
Similar Demographics by College, 1 year or more
Demographics Similar to Koreans by College, 1 year or more
In terms of college, 1 year or more, the demographic groups most similar to Koreans are Immigrants from Somalia (59.7%, a difference of 0.010%), Belgian (59.7%, a difference of 0.020%), Irish (59.6%, a difference of 0.13%), Immigrants from Africa (59.6%, a difference of 0.13%), and Immigrants from North Macedonia (59.5%, a difference of 0.29%).
| Demographics | Rating | Rank | College, 1 year or more |
| Moroccans | 72.9 /100 | #155 | Good 60.2% |
| Finns | 72.9 /100 | #156 | Good 60.2% |
| Immigrants | Armenia | 68.8 /100 | #157 | Good 60.0% |
| English | 67.2 /100 | #158 | Good 60.0% |
| Immigrants | Iraq | 67.0 /100 | #159 | Good 60.0% |
| South American Indians | 66.9 /100 | #160 | Good 60.0% |
| Somalis | 64.5 /100 | #161 | Good 59.9% |
| Koreans | 58.5 /100 | #162 | Average 59.7% |
| Immigrants | Somalia | 58.3 /100 | #163 | Average 59.7% |
| Belgians | 58.1 /100 | #164 | Average 59.7% |
| Irish | 56.1 /100 | #165 | Average 59.6% |
| Immigrants | Africa | 56.1 /100 | #166 | Average 59.6% |
| Immigrants | North Macedonia | 53.1 /100 | #167 | Average 59.5% |
| Hungarians | 52.9 /100 | #168 | Average 59.5% |
| Immigrants | Southern Europe | 52.7 /100 | #169 | Average 59.5% |
Demographics Similar to Alsatians by College, 1 year or more
In terms of college, 1 year or more, the demographic groups most similar to Alsatians are Immigrants from Eastern Africa (61.2%, a difference of 0.030%), Immigrants from Italy (61.2%, a difference of 0.030%), Immigrants from Syria (61.3%, a difference of 0.050%), Ugandan (61.2%, a difference of 0.090%), and Venezuelan (61.3%, a difference of 0.13%).
| Demographics | Rating | Rank | College, 1 year or more |
| Assyrians/Chaldeans/Syriacs | 93.3 /100 | #119 | Exceptional 61.5% |
| Pakistanis | 93.2 /100 | #120 | Exceptional 61.5% |
| Immigrants | Jordan | 92.7 /100 | #121 | Exceptional 61.4% |
| Immigrants | Chile | 92.3 /100 | #122 | Exceptional 61.4% |
| Serbians | 92.2 /100 | #123 | Exceptional 61.4% |
| Venezuelans | 92.1 /100 | #124 | Exceptional 61.3% |
| Immigrants | Syria | 91.6 /100 | #125 | Exceptional 61.3% |
| Alsatians | 91.3 /100 | #126 | Exceptional 61.3% |
| Immigrants | Eastern Africa | 91.1 /100 | #127 | Exceptional 61.2% |
| Immigrants | Italy | 91.1 /100 | #128 | Exceptional 61.2% |
| Ugandans | 90.7 /100 | #129 | Exceptional 61.2% |
| Italians | 89.5 /100 | #130 | Excellent 61.1% |
| Immigrants | Morocco | 89.5 /100 | #131 | Excellent 61.1% |
| Scandinavians | 88.2 /100 | #132 | Excellent 61.0% |
| Immigrants | Uzbekistan | 88.0 /100 | #133 | Excellent 61.0% |