South American vs Immigrants from Jordan College, 1 year or more
COMPARE
South American
Immigrants from Jordan
College, 1 year or more
College, 1 year or more Comparison
South Americans
Immigrants from Jordan
59.0%
COLLEGE, 1 YEAR OR MORE
35.9/ 100
METRIC RATING
185th/ 347
METRIC RANK
61.4%
COLLEGE, 1 YEAR OR MORE
92.7/ 100
METRIC RATING
121st/ 347
METRIC RANK
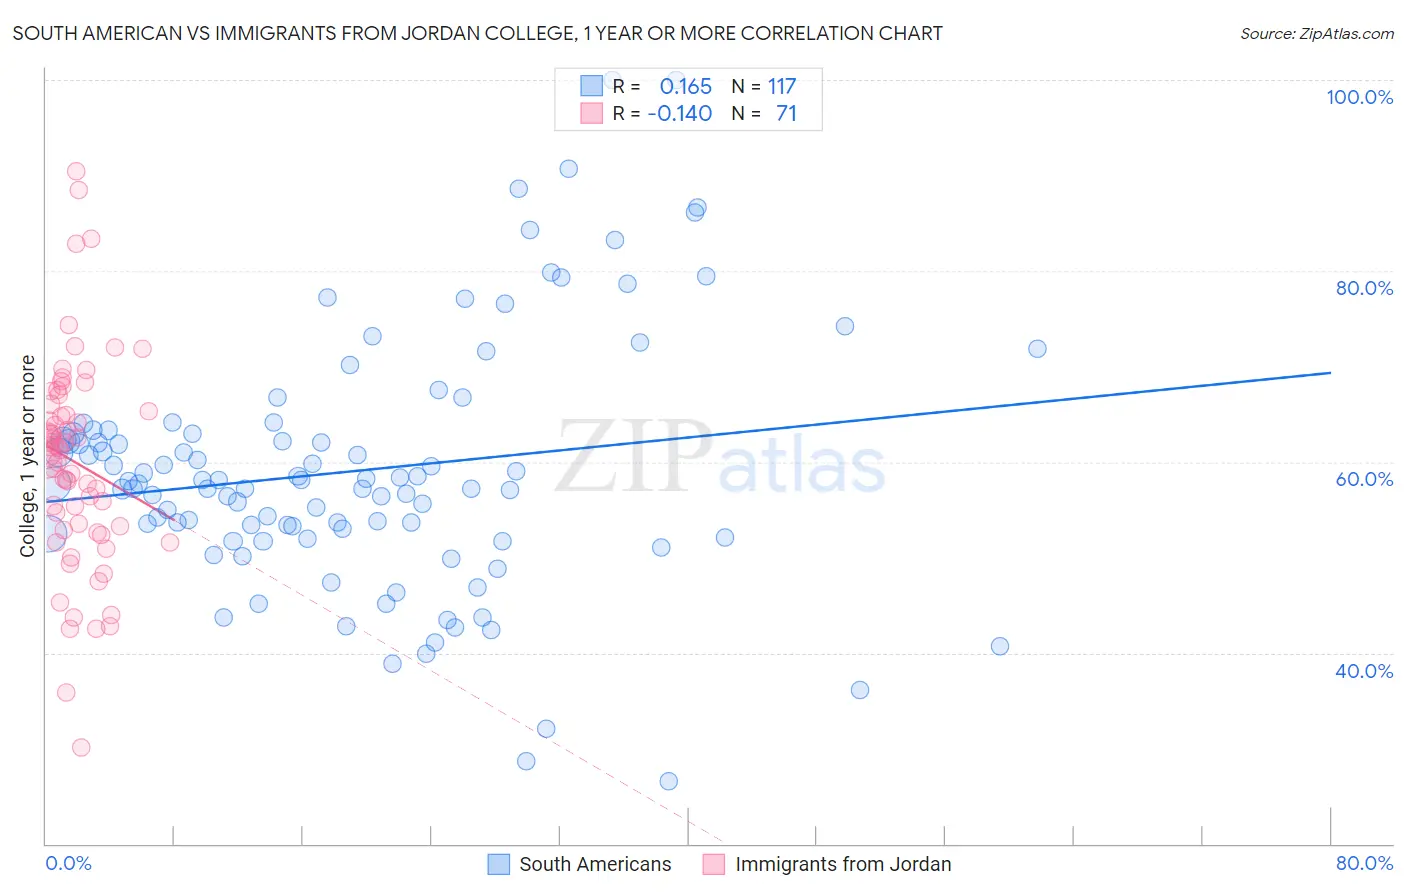
South American vs Immigrants from Jordan College, 1 year or more Correlation Chart
The statistical analysis conducted on geographies consisting of 494,172,173 people shows a poor positive correlation between the proportion of South Americans and percentage of population with at least college, 1 year or more education in the United States with a correlation coefficient (R) of 0.165 and weighted average of 59.0%. Similarly, the statistical analysis conducted on geographies consisting of 181,276,954 people shows a poor negative correlation between the proportion of Immigrants from Jordan and percentage of population with at least college, 1 year or more education in the United States with a correlation coefficient (R) of -0.140 and weighted average of 61.4%, a difference of 4.2%.
College, 1 year or more Correlation Summary
| Measurement | South American | Immigrants from Jordan |
| Minimum | 26.5% | 30.1% |
| Maximum | 100.0% | 90.5% |
| Range | 73.5% | 60.3% |
| Mean | 59.1% | 60.0% |
| Median | 57.8% | 61.3% |
| Interquartile 25% (IQ1) | 52.2% | 52.9% |
| Interquartile 75% (IQ3) | 63.1% | 66.0% |
| Interquartile Range (IQR) | 10.9% | 13.2% |
| Standard Deviation (Sample) | 13.2% | 11.0% |
| Standard Deviation (Population) | 13.2% | 11.0% |
Similar Demographics by College, 1 year or more
Demographics Similar to South Americans by College, 1 year or more
In terms of college, 1 year or more, the demographic groups most similar to South Americans are Scotch-Irish (58.9%, a difference of 0.070%), German (58.9%, a difference of 0.070%), French (58.9%, a difference of 0.090%), Spaniard (59.0%, a difference of 0.14%), and German Russian (59.1%, a difference of 0.20%).
| Demographics | Rating | Rank | College, 1 year or more |
| Czechoslovakians | 48.3 /100 | #178 | Average 59.4% |
| Bermudans | 46.6 /100 | #179 | Average 59.3% |
| Yugoslavians | 44.1 /100 | #180 | Average 59.2% |
| Swiss | 43.4 /100 | #181 | Average 59.2% |
| Immigrants | Bosnia and Herzegovina | 42.8 /100 | #182 | Average 59.2% |
| German Russians | 39.3 /100 | #183 | Fair 59.1% |
| Spaniards | 38.3 /100 | #184 | Fair 59.0% |
| South Americans | 35.9 /100 | #185 | Fair 59.0% |
| Scotch-Irish | 34.7 /100 | #186 | Fair 58.9% |
| Germans | 34.7 /100 | #187 | Fair 58.9% |
| French | 34.4 /100 | #188 | Fair 58.9% |
| Uruguayans | 31.8 /100 | #189 | Fair 58.8% |
| Immigrants | Cameroon | 31.2 /100 | #190 | Fair 58.8% |
| Immigrants | Philippines | 29.2 /100 | #191 | Fair 58.7% |
| Colombians | 27.6 /100 | #192 | Fair 58.7% |
Demographics Similar to Immigrants from Jordan by College, 1 year or more
In terms of college, 1 year or more, the demographic groups most similar to Immigrants from Jordan are Immigrants from Chile (61.4%, a difference of 0.080%), Pakistani (61.5%, a difference of 0.10%), Serbian (61.4%, a difference of 0.10%), Assyrian/Chaldean/Syriac (61.5%, a difference of 0.11%), and Venezuelan (61.3%, a difference of 0.12%).
| Demographics | Rating | Rank | College, 1 year or more |
| Danes | 94.8 /100 | #114 | Exceptional 61.7% |
| Norwegians | 94.5 /100 | #115 | Exceptional 61.7% |
| Lebanese | 94.1 /100 | #116 | Exceptional 61.6% |
| Arabs | 93.9 /100 | #117 | Exceptional 61.6% |
| Immigrants | Brazil | 93.9 /100 | #118 | Exceptional 61.6% |
| Assyrians/Chaldeans/Syriacs | 93.3 /100 | #119 | Exceptional 61.5% |
| Pakistanis | 93.2 /100 | #120 | Exceptional 61.5% |
| Immigrants | Jordan | 92.7 /100 | #121 | Exceptional 61.4% |
| Immigrants | Chile | 92.3 /100 | #122 | Exceptional 61.4% |
| Serbians | 92.2 /100 | #123 | Exceptional 61.4% |
| Venezuelans | 92.1 /100 | #124 | Exceptional 61.3% |
| Immigrants | Syria | 91.6 /100 | #125 | Exceptional 61.3% |
| Alsatians | 91.3 /100 | #126 | Exceptional 61.3% |
| Immigrants | Eastern Africa | 91.1 /100 | #127 | Exceptional 61.2% |
| Immigrants | Italy | 91.1 /100 | #128 | Exceptional 61.2% |