Estonian vs Alsatian College, 1 year or more
COMPARE
Estonian
Alsatian
College, 1 year or more
College, 1 year or more Comparison
Estonians
Alsatians
65.0%
COLLEGE, 1 YEAR OR MORE
99.9/ 100
METRIC RATING
39th/ 347
METRIC RANK
61.3%
COLLEGE, 1 YEAR OR MORE
91.3/ 100
METRIC RATING
126th/ 347
METRIC RANK
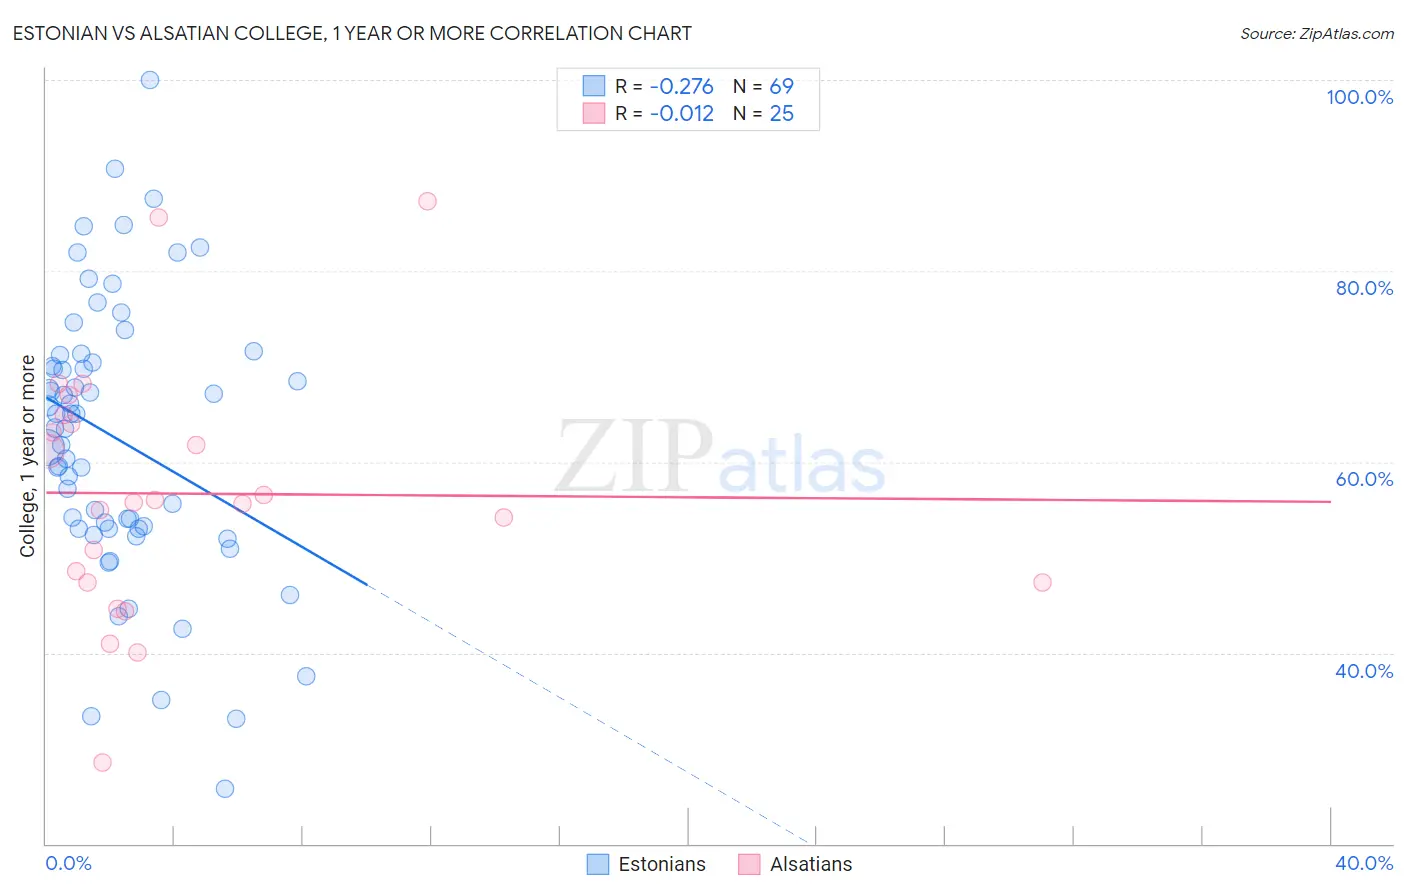
Estonian vs Alsatian College, 1 year or more Correlation Chart
The statistical analysis conducted on geographies consisting of 123,528,478 people shows a weak negative correlation between the proportion of Estonians and percentage of population with at least college, 1 year or more education in the United States with a correlation coefficient (R) of -0.276 and weighted average of 65.0%. Similarly, the statistical analysis conducted on geographies consisting of 82,682,365 people shows no correlation between the proportion of Alsatians and percentage of population with at least college, 1 year or more education in the United States with a correlation coefficient (R) of -0.012 and weighted average of 61.3%, a difference of 6.1%.
College, 1 year or more Correlation Summary
| Measurement | Estonian | Alsatian |
| Minimum | 25.8% | 28.5% |
| Maximum | 100.0% | 87.3% |
| Range | 74.2% | 58.8% |
| Mean | 62.4% | 56.7% |
| Median | 63.5% | 55.8% |
| Interquartile 25% (IQ1) | 53.0% | 47.4% |
| Interquartile 75% (IQ3) | 70.8% | 64.4% |
| Interquartile Range (IQR) | 17.8% | 17.1% |
| Standard Deviation (Sample) | 14.5% | 13.3% |
| Standard Deviation (Population) | 14.4% | 13.0% |
Similar Demographics by College, 1 year or more
Demographics Similar to Estonians by College, 1 year or more
In terms of college, 1 year or more, the demographic groups most similar to Estonians are Immigrants from Kuwait (65.0%, a difference of 0.060%), Immigrants from Saudi Arabia (65.0%, a difference of 0.070%), Russian (65.1%, a difference of 0.22%), Immigrants from South Africa (65.1%, a difference of 0.23%), and Mongolian (64.8%, a difference of 0.26%).
| Demographics | Rating | Rank | College, 1 year or more |
| Bulgarians | 100.0 /100 | #32 | Exceptional 65.5% |
| Immigrants | Sri Lanka | 99.9 /100 | #33 | Exceptional 65.4% |
| Israelis | 99.9 /100 | #34 | Exceptional 65.3% |
| Immigrants | Turkey | 99.9 /100 | #35 | Exceptional 65.2% |
| Immigrants | South Africa | 99.9 /100 | #36 | Exceptional 65.1% |
| Russians | 99.9 /100 | #37 | Exceptional 65.1% |
| Immigrants | Saudi Arabia | 99.9 /100 | #38 | Exceptional 65.0% |
| Estonians | 99.9 /100 | #39 | Exceptional 65.0% |
| Immigrants | Kuwait | 99.9 /100 | #40 | Exceptional 65.0% |
| Mongolians | 99.9 /100 | #41 | Exceptional 64.8% |
| Immigrants | Latvia | 99.9 /100 | #42 | Exceptional 64.8% |
| Immigrants | Russia | 99.9 /100 | #43 | Exceptional 64.7% |
| Immigrants | Norway | 99.9 /100 | #44 | Exceptional 64.7% |
| Immigrants | Lithuania | 99.9 /100 | #45 | Exceptional 64.6% |
| Bhutanese | 99.9 /100 | #46 | Exceptional 64.6% |
Demographics Similar to Alsatians by College, 1 year or more
In terms of college, 1 year or more, the demographic groups most similar to Alsatians are Immigrants from Eastern Africa (61.2%, a difference of 0.030%), Immigrants from Italy (61.2%, a difference of 0.030%), Immigrants from Syria (61.3%, a difference of 0.050%), Ugandan (61.2%, a difference of 0.090%), and Venezuelan (61.3%, a difference of 0.13%).
| Demographics | Rating | Rank | College, 1 year or more |
| Assyrians/Chaldeans/Syriacs | 93.3 /100 | #119 | Exceptional 61.5% |
| Pakistanis | 93.2 /100 | #120 | Exceptional 61.5% |
| Immigrants | Jordan | 92.7 /100 | #121 | Exceptional 61.4% |
| Immigrants | Chile | 92.3 /100 | #122 | Exceptional 61.4% |
| Serbians | 92.2 /100 | #123 | Exceptional 61.4% |
| Venezuelans | 92.1 /100 | #124 | Exceptional 61.3% |
| Immigrants | Syria | 91.6 /100 | #125 | Exceptional 61.3% |
| Alsatians | 91.3 /100 | #126 | Exceptional 61.3% |
| Immigrants | Eastern Africa | 91.1 /100 | #127 | Exceptional 61.2% |
| Immigrants | Italy | 91.1 /100 | #128 | Exceptional 61.2% |
| Ugandans | 90.7 /100 | #129 | Exceptional 61.2% |
| Italians | 89.5 /100 | #130 | Excellent 61.1% |
| Immigrants | Morocco | 89.5 /100 | #131 | Excellent 61.1% |
| Scandinavians | 88.2 /100 | #132 | Excellent 61.0% |
| Immigrants | Uzbekistan | 88.0 /100 | #133 | Excellent 61.0% |