South American vs Immigrants from Europe College, 1 year or more
COMPARE
South American
Immigrants from Europe
College, 1 year or more
College, 1 year or more Comparison
South Americans
Immigrants from Europe
59.0%
COLLEGE, 1 YEAR OR MORE
35.9/ 100
METRIC RATING
185th/ 347
METRIC RANK
63.3%
COLLEGE, 1 YEAR OR MORE
99.3/ 100
METRIC RATING
66th/ 347
METRIC RANK
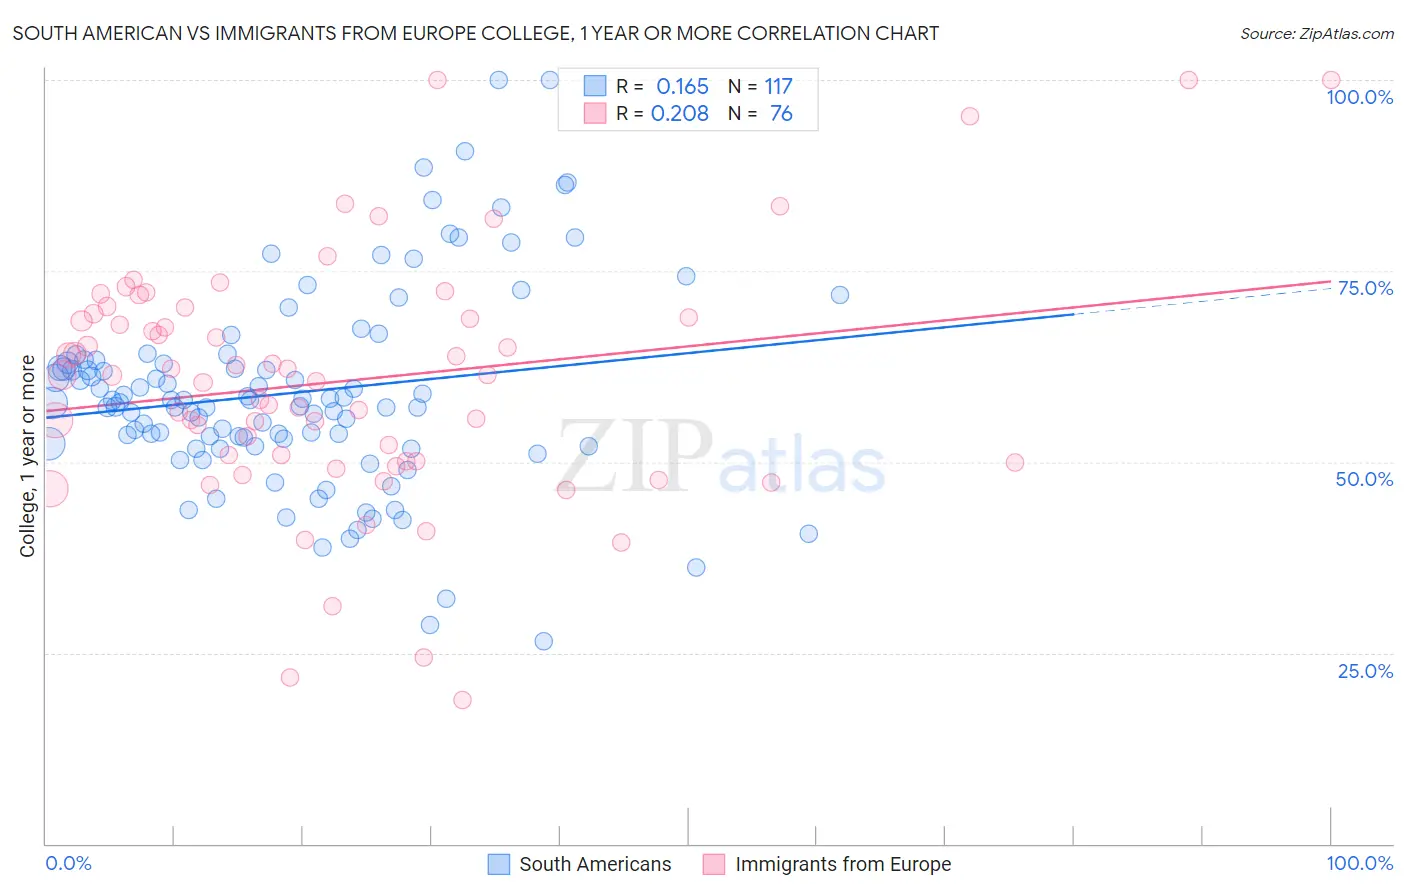
South American vs Immigrants from Europe College, 1 year or more Correlation Chart
The statistical analysis conducted on geographies consisting of 494,172,173 people shows a poor positive correlation between the proportion of South Americans and percentage of population with at least college, 1 year or more education in the United States with a correlation coefficient (R) of 0.165 and weighted average of 59.0%. Similarly, the statistical analysis conducted on geographies consisting of 547,418,471 people shows a weak positive correlation between the proportion of Immigrants from Europe and percentage of population with at least college, 1 year or more education in the United States with a correlation coefficient (R) of 0.208 and weighted average of 63.3%, a difference of 7.4%.
College, 1 year or more Correlation Summary
| Measurement | South American | Immigrants from Europe |
| Minimum | 26.5% | 18.8% |
| Maximum | 100.0% | 100.0% |
| Range | 73.5% | 81.2% |
| Mean | 59.1% | 60.6% |
| Median | 57.8% | 61.4% |
| Interquartile 25% (IQ1) | 52.2% | 50.0% |
| Interquartile 75% (IQ3) | 63.1% | 69.1% |
| Interquartile Range (IQR) | 10.9% | 19.1% |
| Standard Deviation (Sample) | 13.2% | 16.1% |
| Standard Deviation (Population) | 13.2% | 15.9% |
Similar Demographics by College, 1 year or more
Demographics Similar to South Americans by College, 1 year or more
In terms of college, 1 year or more, the demographic groups most similar to South Americans are Scotch-Irish (58.9%, a difference of 0.070%), German (58.9%, a difference of 0.070%), French (58.9%, a difference of 0.090%), Spaniard (59.0%, a difference of 0.14%), and German Russian (59.1%, a difference of 0.20%).
| Demographics | Rating | Rank | College, 1 year or more |
| Czechoslovakians | 48.3 /100 | #178 | Average 59.4% |
| Bermudans | 46.6 /100 | #179 | Average 59.3% |
| Yugoslavians | 44.1 /100 | #180 | Average 59.2% |
| Swiss | 43.4 /100 | #181 | Average 59.2% |
| Immigrants | Bosnia and Herzegovina | 42.8 /100 | #182 | Average 59.2% |
| German Russians | 39.3 /100 | #183 | Fair 59.1% |
| Spaniards | 38.3 /100 | #184 | Fair 59.0% |
| South Americans | 35.9 /100 | #185 | Fair 59.0% |
| Scotch-Irish | 34.7 /100 | #186 | Fair 58.9% |
| Germans | 34.7 /100 | #187 | Fair 58.9% |
| French | 34.4 /100 | #188 | Fair 58.9% |
| Uruguayans | 31.8 /100 | #189 | Fair 58.8% |
| Immigrants | Cameroon | 31.2 /100 | #190 | Fair 58.8% |
| Immigrants | Philippines | 29.2 /100 | #191 | Fair 58.7% |
| Colombians | 27.6 /100 | #192 | Fair 58.7% |
Demographics Similar to Immigrants from Europe by College, 1 year or more
In terms of college, 1 year or more, the demographic groups most similar to Immigrants from Europe are Immigrants from Romania (63.3%, a difference of 0.020%), Immigrants from Greece (63.3%, a difference of 0.030%), Immigrants from Zimbabwe (63.3%, a difference of 0.040%), Maltese (63.4%, a difference of 0.10%), and Argentinean (63.2%, a difference of 0.13%).
| Demographics | Rating | Rank | College, 1 year or more |
| Immigrants | Serbia | 99.6 /100 | #59 | Exceptional 63.8% |
| Immigrants | Kazakhstan | 99.5 /100 | #60 | Exceptional 63.6% |
| Bolivians | 99.5 /100 | #61 | Exceptional 63.5% |
| Immigrants | Indonesia | 99.5 /100 | #62 | Exceptional 63.5% |
| Immigrants | Scotland | 99.4 /100 | #63 | Exceptional 63.4% |
| Immigrants | Spain | 99.4 /100 | #64 | Exceptional 63.4% |
| Maltese | 99.3 /100 | #65 | Exceptional 63.4% |
| Immigrants | Europe | 99.3 /100 | #66 | Exceptional 63.3% |
| Immigrants | Romania | 99.3 /100 | #67 | Exceptional 63.3% |
| Immigrants | Greece | 99.3 /100 | #68 | Exceptional 63.3% |
| Immigrants | Zimbabwe | 99.3 /100 | #69 | Exceptional 63.3% |
| Argentineans | 99.2 /100 | #70 | Exceptional 63.2% |
| Immigrants | Canada | 99.1 /100 | #71 | Exceptional 63.1% |
| Egyptians | 99.0 /100 | #72 | Exceptional 63.1% |
| Immigrants | Moldova | 99.0 /100 | #73 | Exceptional 63.0% |