South American vs Somali College, 1 year or more
COMPARE
South American
Somali
College, 1 year or more
College, 1 year or more Comparison
South Americans
Somalis
59.0%
COLLEGE, 1 YEAR OR MORE
35.9/ 100
METRIC RATING
185th/ 347
METRIC RANK
59.9%
COLLEGE, 1 YEAR OR MORE
64.5/ 100
METRIC RATING
161st/ 347
METRIC RANK
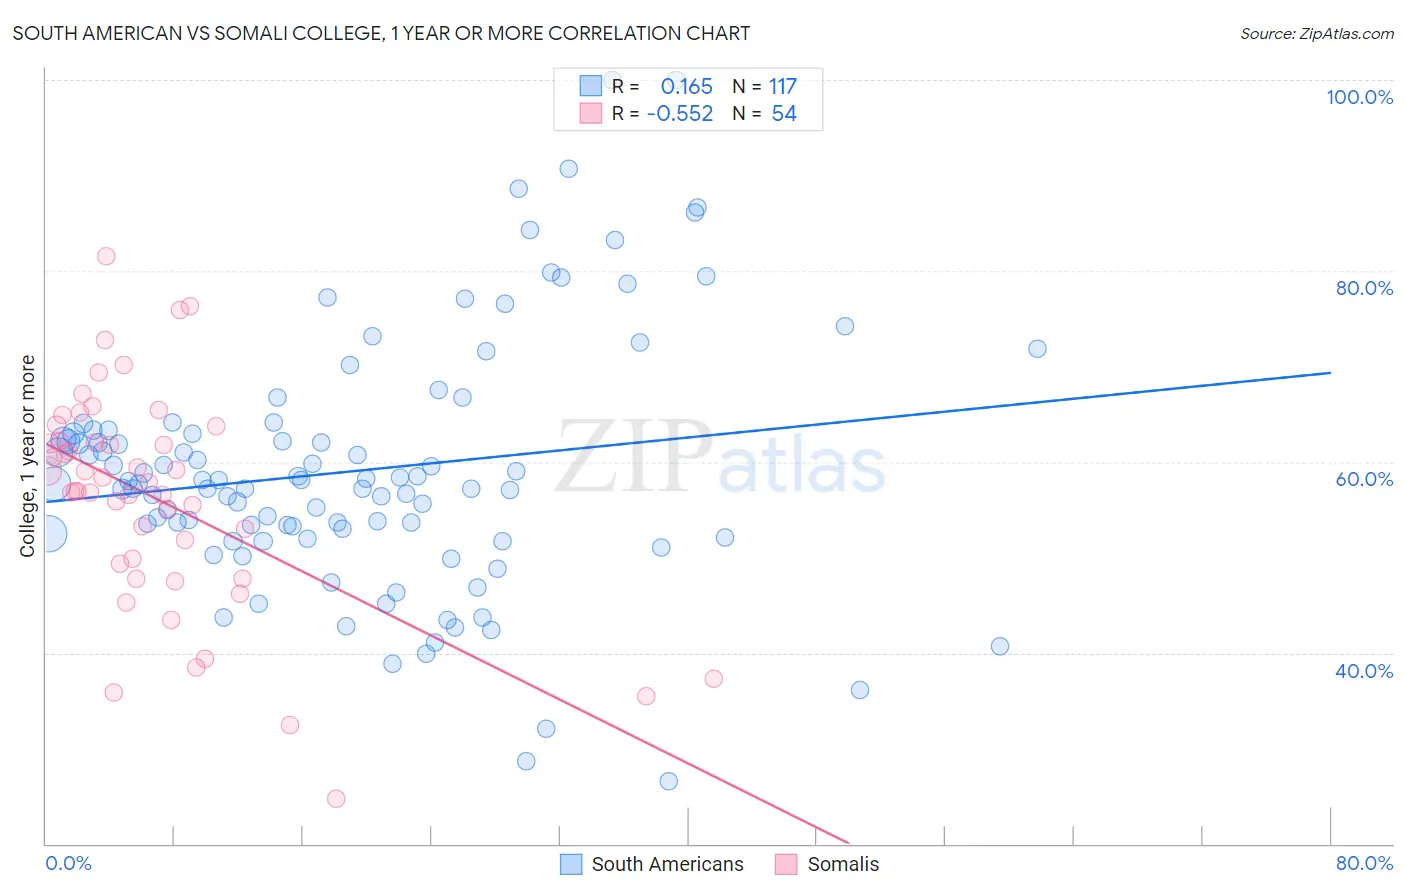
South American vs Somali College, 1 year or more Correlation Chart
The statistical analysis conducted on geographies consisting of 494,172,173 people shows a poor positive correlation between the proportion of South Americans and percentage of population with at least college, 1 year or more education in the United States with a correlation coefficient (R) of 0.165 and weighted average of 59.0%. Similarly, the statistical analysis conducted on geographies consisting of 99,332,457 people shows a substantial negative correlation between the proportion of Somalis and percentage of population with at least college, 1 year or more education in the United States with a correlation coefficient (R) of -0.552 and weighted average of 59.9%, a difference of 1.6%.
College, 1 year or more Correlation Summary
| Measurement | South American | Somali |
| Minimum | 26.5% | 24.7% |
| Maximum | 100.0% | 81.5% |
| Range | 73.5% | 56.8% |
| Mean | 59.1% | 56.2% |
| Median | 57.8% | 57.4% |
| Interquartile 25% (IQ1) | 52.2% | 49.3% |
| Interquartile 75% (IQ3) | 63.1% | 62.1% |
| Interquartile Range (IQR) | 10.9% | 12.9% |
| Standard Deviation (Sample) | 13.2% | 11.5% |
| Standard Deviation (Population) | 13.2% | 11.4% |
Similar Demographics by College, 1 year or more
Demographics Similar to South Americans by College, 1 year or more
In terms of college, 1 year or more, the demographic groups most similar to South Americans are Scotch-Irish (58.9%, a difference of 0.070%), German (58.9%, a difference of 0.070%), French (58.9%, a difference of 0.090%), Spaniard (59.0%, a difference of 0.14%), and German Russian (59.1%, a difference of 0.20%).
| Demographics | Rating | Rank | College, 1 year or more |
| Czechoslovakians | 48.3 /100 | #178 | Average 59.4% |
| Bermudans | 46.6 /100 | #179 | Average 59.3% |
| Yugoslavians | 44.1 /100 | #180 | Average 59.2% |
| Swiss | 43.4 /100 | #181 | Average 59.2% |
| Immigrants | Bosnia and Herzegovina | 42.8 /100 | #182 | Average 59.2% |
| German Russians | 39.3 /100 | #183 | Fair 59.1% |
| Spaniards | 38.3 /100 | #184 | Fair 59.0% |
| South Americans | 35.9 /100 | #185 | Fair 59.0% |
| Scotch-Irish | 34.7 /100 | #186 | Fair 58.9% |
| Germans | 34.7 /100 | #187 | Fair 58.9% |
| French | 34.4 /100 | #188 | Fair 58.9% |
| Uruguayans | 31.8 /100 | #189 | Fair 58.8% |
| Immigrants | Cameroon | 31.2 /100 | #190 | Fair 58.8% |
| Immigrants | Philippines | 29.2 /100 | #191 | Fair 58.7% |
| Colombians | 27.6 /100 | #192 | Fair 58.7% |
Demographics Similar to Somalis by College, 1 year or more
In terms of college, 1 year or more, the demographic groups most similar to Somalis are South American Indian (60.0%, a difference of 0.14%), English (60.0%, a difference of 0.15%), Immigrants from Iraq (60.0%, a difference of 0.15%), Immigrants from Armenia (60.0%, a difference of 0.25%), and Korean (59.7%, a difference of 0.34%).
| Demographics | Rating | Rank | College, 1 year or more |
| Sudanese | 73.0 /100 | #154 | Good 60.2% |
| Moroccans | 72.9 /100 | #155 | Good 60.2% |
| Finns | 72.9 /100 | #156 | Good 60.2% |
| Immigrants | Armenia | 68.8 /100 | #157 | Good 60.0% |
| English | 67.2 /100 | #158 | Good 60.0% |
| Immigrants | Iraq | 67.0 /100 | #159 | Good 60.0% |
| South American Indians | 66.9 /100 | #160 | Good 60.0% |
| Somalis | 64.5 /100 | #161 | Good 59.9% |
| Koreans | 58.5 /100 | #162 | Average 59.7% |
| Immigrants | Somalia | 58.3 /100 | #163 | Average 59.7% |
| Belgians | 58.1 /100 | #164 | Average 59.7% |
| Irish | 56.1 /100 | #165 | Average 59.6% |
| Immigrants | Africa | 56.1 /100 | #166 | Average 59.6% |
| Immigrants | North Macedonia | 53.1 /100 | #167 | Average 59.5% |
| Hungarians | 52.9 /100 | #168 | Average 59.5% |