South American vs Immigrants from Ukraine College, 1 year or more
COMPARE
South American
Immigrants from Ukraine
College, 1 year or more
College, 1 year or more Comparison
South Americans
Immigrants from Ukraine
59.0%
COLLEGE, 1 YEAR OR MORE
35.9/ 100
METRIC RATING
185th/ 347
METRIC RANK
61.9%
COLLEGE, 1 YEAR OR MORE
95.8/ 100
METRIC RATING
107th/ 347
METRIC RANK
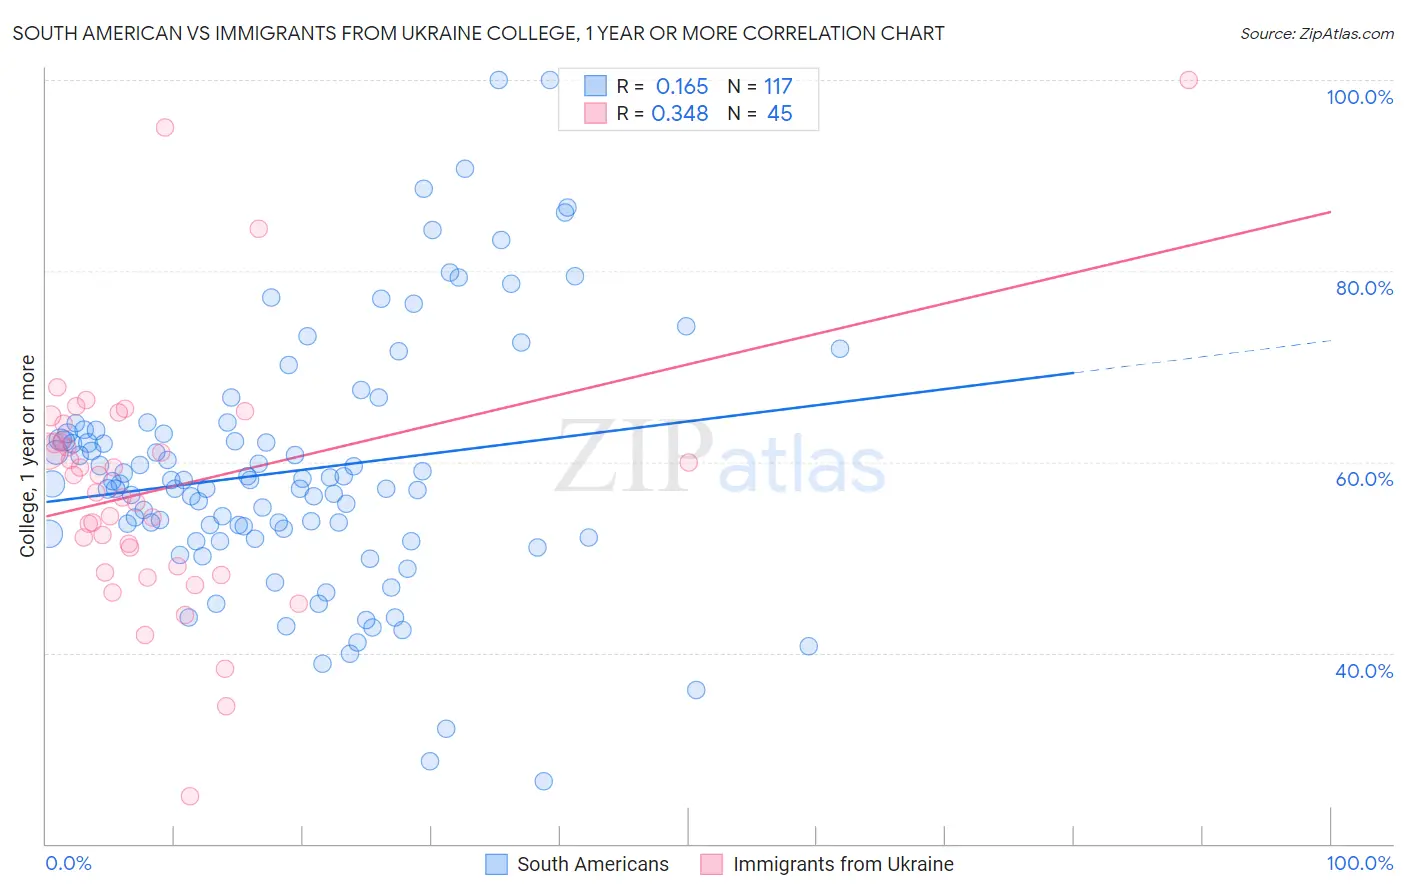
South American vs Immigrants from Ukraine College, 1 year or more Correlation Chart
The statistical analysis conducted on geographies consisting of 494,172,173 people shows a poor positive correlation between the proportion of South Americans and percentage of population with at least college, 1 year or more education in the United States with a correlation coefficient (R) of 0.165 and weighted average of 59.0%. Similarly, the statistical analysis conducted on geographies consisting of 289,712,941 people shows a mild positive correlation between the proportion of Immigrants from Ukraine and percentage of population with at least college, 1 year or more education in the United States with a correlation coefficient (R) of 0.348 and weighted average of 61.9%, a difference of 5.0%.
College, 1 year or more Correlation Summary
| Measurement | South American | Immigrants from Ukraine |
| Minimum | 26.5% | 25.0% |
| Maximum | 100.0% | 100.0% |
| Range | 73.5% | 75.0% |
| Mean | 59.1% | 57.2% |
| Median | 57.8% | 56.8% |
| Interquartile 25% (IQ1) | 52.2% | 48.8% |
| Interquartile 75% (IQ3) | 63.1% | 63.0% |
| Interquartile Range (IQR) | 10.9% | 14.2% |
| Standard Deviation (Sample) | 13.2% | 13.4% |
| Standard Deviation (Population) | 13.2% | 13.2% |
Similar Demographics by College, 1 year or more
Demographics Similar to South Americans by College, 1 year or more
In terms of college, 1 year or more, the demographic groups most similar to South Americans are Scotch-Irish (58.9%, a difference of 0.070%), German (58.9%, a difference of 0.070%), French (58.9%, a difference of 0.090%), Spaniard (59.0%, a difference of 0.14%), and German Russian (59.1%, a difference of 0.20%).
| Demographics | Rating | Rank | College, 1 year or more |
| Czechoslovakians | 48.3 /100 | #178 | Average 59.4% |
| Bermudans | 46.6 /100 | #179 | Average 59.3% |
| Yugoslavians | 44.1 /100 | #180 | Average 59.2% |
| Swiss | 43.4 /100 | #181 | Average 59.2% |
| Immigrants | Bosnia and Herzegovina | 42.8 /100 | #182 | Average 59.2% |
| German Russians | 39.3 /100 | #183 | Fair 59.1% |
| Spaniards | 38.3 /100 | #184 | Fair 59.0% |
| South Americans | 35.9 /100 | #185 | Fair 59.0% |
| Scotch-Irish | 34.7 /100 | #186 | Fair 58.9% |
| Germans | 34.7 /100 | #187 | Fair 58.9% |
| French | 34.4 /100 | #188 | Fair 58.9% |
| Uruguayans | 31.8 /100 | #189 | Fair 58.8% |
| Immigrants | Cameroon | 31.2 /100 | #190 | Fair 58.8% |
| Immigrants | Philippines | 29.2 /100 | #191 | Fair 58.7% |
| Colombians | 27.6 /100 | #192 | Fair 58.7% |
Demographics Similar to Immigrants from Ukraine by College, 1 year or more
In terms of college, 1 year or more, the demographic groups most similar to Immigrants from Ukraine are Syrian (61.9%, a difference of 0.020%), Immigrants from Northern Africa (61.9%, a difference of 0.020%), European (61.8%, a difference of 0.040%), Macedonian (61.8%, a difference of 0.040%), and Austrian (61.8%, a difference of 0.10%).
| Demographics | Rating | Rank | College, 1 year or more |
| Icelanders | 96.8 /100 | #100 | Exceptional 62.1% |
| Swedes | 96.8 /100 | #101 | Exceptional 62.1% |
| Luxembourgers | 96.7 /100 | #102 | Exceptional 62.1% |
| Afghans | 96.4 /100 | #103 | Exceptional 62.0% |
| Chileans | 96.4 /100 | #104 | Exceptional 62.0% |
| Immigrants | Nepal | 96.3 /100 | #105 | Exceptional 62.0% |
| Palestinians | 96.3 /100 | #106 | Exceptional 62.0% |
| Immigrants | Ukraine | 95.8 /100 | #107 | Exceptional 61.9% |
| Syrians | 95.7 /100 | #108 | Exceptional 61.9% |
| Immigrants | Northern Africa | 95.7 /100 | #109 | Exceptional 61.9% |
| Europeans | 95.6 /100 | #110 | Exceptional 61.8% |
| Macedonians | 95.6 /100 | #111 | Exceptional 61.8% |
| Austrians | 95.4 /100 | #112 | Exceptional 61.8% |
| Ukrainians | 95.2 /100 | #113 | Exceptional 61.8% |
| Danes | 94.8 /100 | #114 | Exceptional 61.7% |