Immigrants from Bolivia vs Alsatian College, 1 year or more
COMPARE
Immigrants from Bolivia
Alsatian
College, 1 year or more
College, 1 year or more Comparison
Immigrants from Bolivia
Alsatians
62.8%
COLLEGE, 1 YEAR OR MORE
98.7/ 100
METRIC RATING
82nd/ 347
METRIC RANK
61.3%
COLLEGE, 1 YEAR OR MORE
91.3/ 100
METRIC RATING
126th/ 347
METRIC RANK
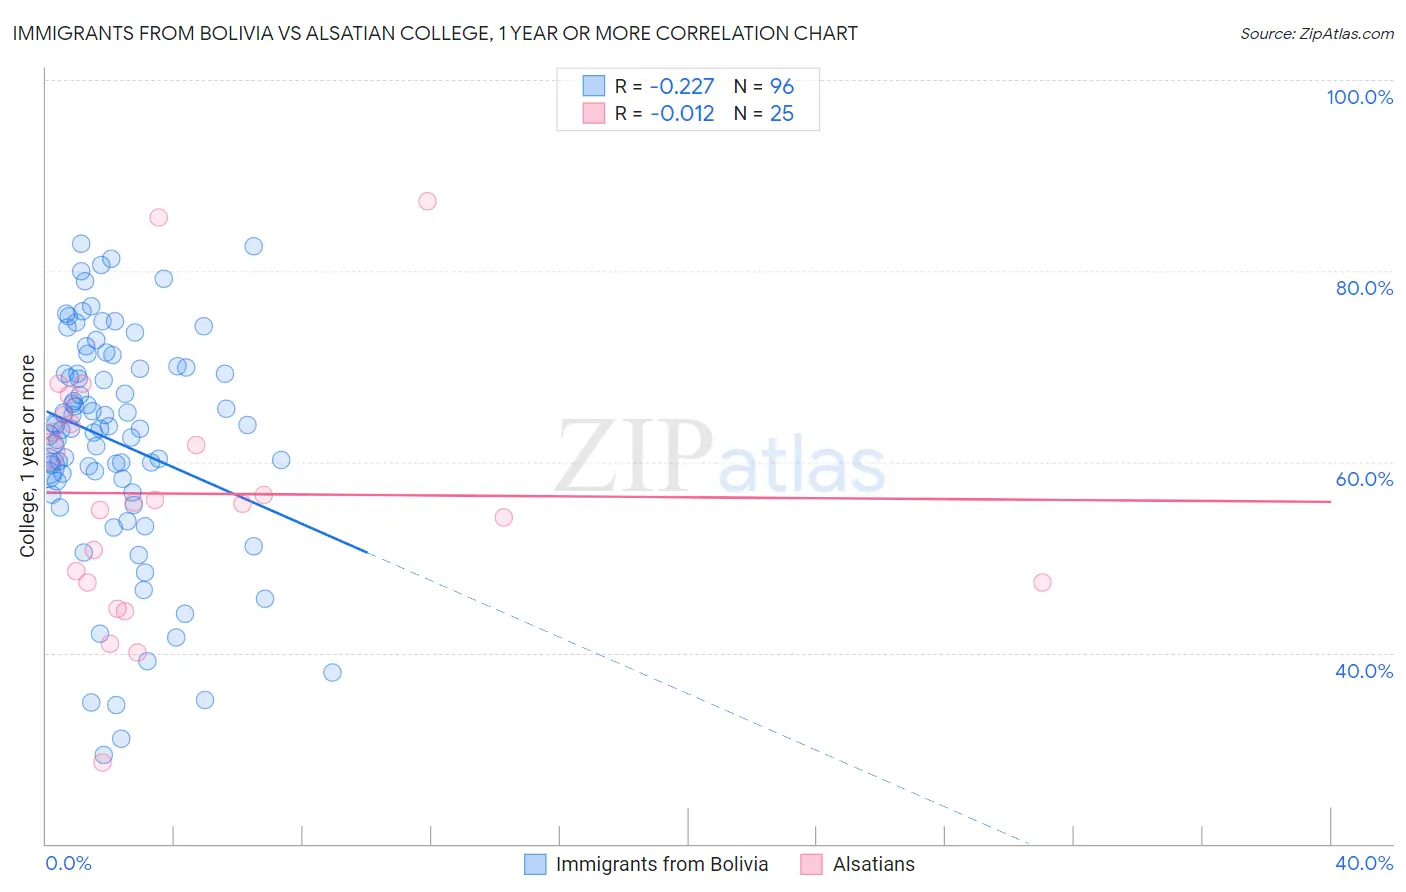
Immigrants from Bolivia vs Alsatian College, 1 year or more Correlation Chart
The statistical analysis conducted on geographies consisting of 158,732,804 people shows a weak negative correlation between the proportion of Immigrants from Bolivia and percentage of population with at least college, 1 year or more education in the United States with a correlation coefficient (R) of -0.227 and weighted average of 62.8%. Similarly, the statistical analysis conducted on geographies consisting of 82,682,365 people shows no correlation between the proportion of Alsatians and percentage of population with at least college, 1 year or more education in the United States with a correlation coefficient (R) of -0.012 and weighted average of 61.3%, a difference of 2.5%.
College, 1 year or more Correlation Summary
| Measurement | Immigrants from Bolivia | Alsatian |
| Minimum | 29.3% | 28.5% |
| Maximum | 82.9% | 87.3% |
| Range | 53.5% | 58.8% |
| Mean | 62.2% | 56.7% |
| Median | 63.5% | 55.8% |
| Interquartile 25% (IQ1) | 58.1% | 47.4% |
| Interquartile 75% (IQ3) | 69.8% | 64.4% |
| Interquartile Range (IQR) | 11.7% | 17.1% |
| Standard Deviation (Sample) | 11.9% | 13.3% |
| Standard Deviation (Population) | 11.8% | 13.0% |
Similar Demographics by College, 1 year or more
Demographics Similar to Immigrants from Bolivia by College, 1 year or more
In terms of college, 1 year or more, the demographic groups most similar to Immigrants from Bolivia are Immigrants from Argentina (62.8%, a difference of 0.040%), Laotian (62.8%, a difference of 0.050%), Immigrants from England (62.8%, a difference of 0.070%), Immigrants from Pakistan (62.8%, a difference of 0.080%), and Lithuanian (62.9%, a difference of 0.10%).
| Demographics | Rating | Rank | College, 1 year or more |
| Armenians | 98.9 /100 | #75 | Exceptional 63.0% |
| Paraguayans | 98.8 /100 | #76 | Exceptional 62.9% |
| Ethiopians | 98.8 /100 | #77 | Exceptional 62.9% |
| Immigrants | Lebanon | 98.8 /100 | #78 | Exceptional 62.9% |
| Northern Europeans | 98.8 /100 | #79 | Exceptional 62.9% |
| Lithuanians | 98.8 /100 | #80 | Exceptional 62.9% |
| Laotians | 98.7 /100 | #81 | Exceptional 62.8% |
| Immigrants | Bolivia | 98.7 /100 | #82 | Exceptional 62.8% |
| Immigrants | Argentina | 98.6 /100 | #83 | Exceptional 62.8% |
| Immigrants | England | 98.6 /100 | #84 | Exceptional 62.8% |
| Immigrants | Pakistan | 98.6 /100 | #85 | Exceptional 62.8% |
| Immigrants | Western Europe | 98.6 /100 | #86 | Exceptional 62.7% |
| Immigrants | Hungary | 98.6 /100 | #87 | Exceptional 62.7% |
| Greeks | 98.3 /100 | #88 | Exceptional 62.6% |
| Immigrants | Ethiopia | 98.2 /100 | #89 | Exceptional 62.6% |
Demographics Similar to Alsatians by College, 1 year or more
In terms of college, 1 year or more, the demographic groups most similar to Alsatians are Immigrants from Eastern Africa (61.2%, a difference of 0.030%), Immigrants from Italy (61.2%, a difference of 0.030%), Immigrants from Syria (61.3%, a difference of 0.050%), Ugandan (61.2%, a difference of 0.090%), and Venezuelan (61.3%, a difference of 0.13%).
| Demographics | Rating | Rank | College, 1 year or more |
| Assyrians/Chaldeans/Syriacs | 93.3 /100 | #119 | Exceptional 61.5% |
| Pakistanis | 93.2 /100 | #120 | Exceptional 61.5% |
| Immigrants | Jordan | 92.7 /100 | #121 | Exceptional 61.4% |
| Immigrants | Chile | 92.3 /100 | #122 | Exceptional 61.4% |
| Serbians | 92.2 /100 | #123 | Exceptional 61.4% |
| Venezuelans | 92.1 /100 | #124 | Exceptional 61.3% |
| Immigrants | Syria | 91.6 /100 | #125 | Exceptional 61.3% |
| Alsatians | 91.3 /100 | #126 | Exceptional 61.3% |
| Immigrants | Eastern Africa | 91.1 /100 | #127 | Exceptional 61.2% |
| Immigrants | Italy | 91.1 /100 | #128 | Exceptional 61.2% |
| Ugandans | 90.7 /100 | #129 | Exceptional 61.2% |
| Italians | 89.5 /100 | #130 | Excellent 61.1% |
| Immigrants | Morocco | 89.5 /100 | #131 | Excellent 61.1% |
| Scandinavians | 88.2 /100 | #132 | Excellent 61.0% |
| Immigrants | Uzbekistan | 88.0 /100 | #133 | Excellent 61.0% |