Immigrants from Panama vs Alsatian College, 1 year or more
COMPARE
Immigrants from Panama
Alsatian
College, 1 year or more
College, 1 year or more Comparison
Immigrants from Panama
Alsatians
57.6%
COLLEGE, 1 YEAR OR MORE
9.1/ 100
METRIC RATING
217th/ 347
METRIC RANK
61.3%
COLLEGE, 1 YEAR OR MORE
91.3/ 100
METRIC RATING
126th/ 347
METRIC RANK
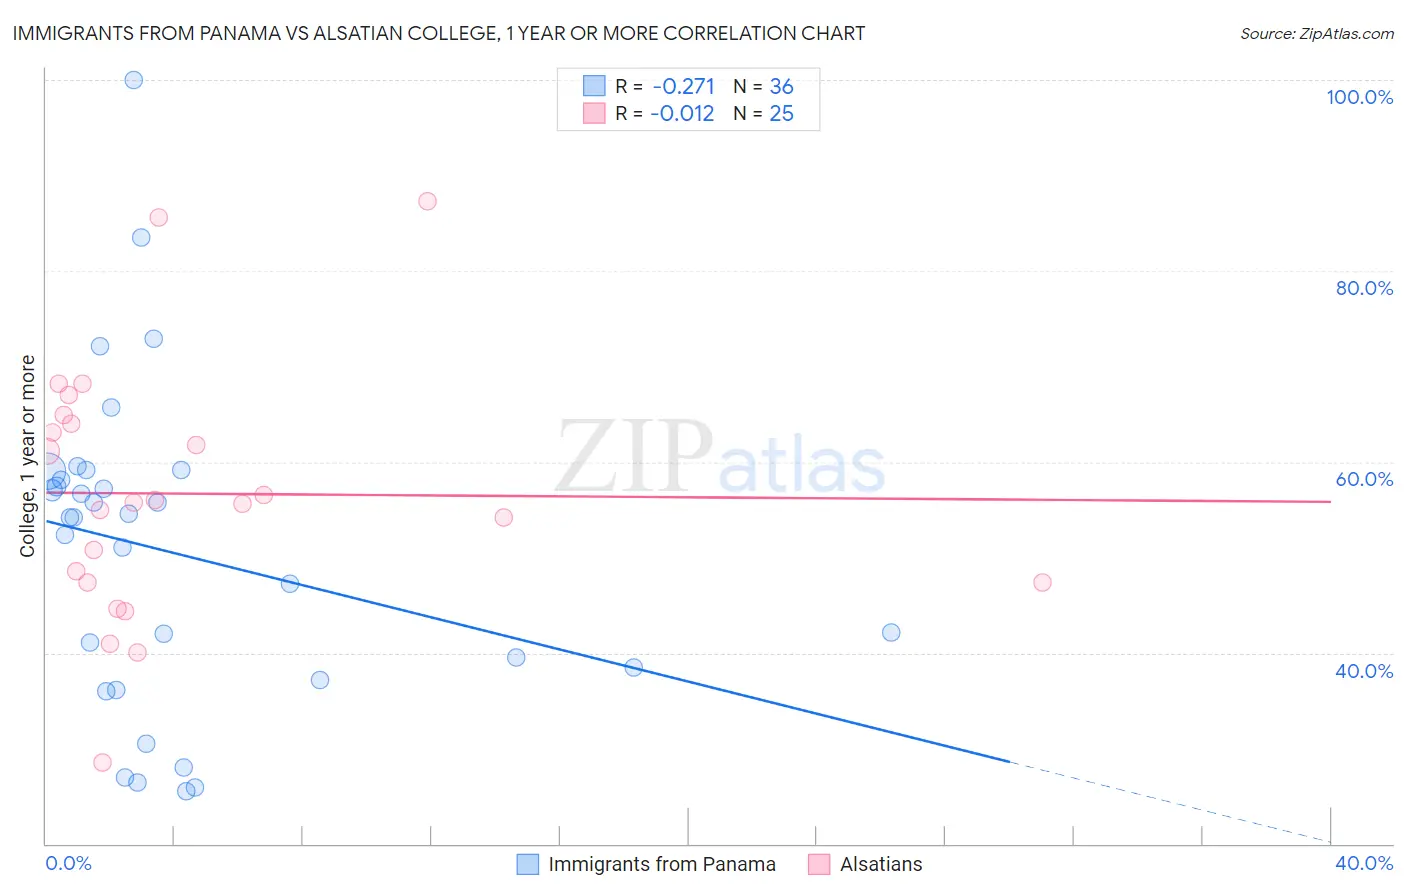
Immigrants from Panama vs Alsatian College, 1 year or more Correlation Chart
The statistical analysis conducted on geographies consisting of 221,184,524 people shows a weak negative correlation between the proportion of Immigrants from Panama and percentage of population with at least college, 1 year or more education in the United States with a correlation coefficient (R) of -0.271 and weighted average of 57.6%. Similarly, the statistical analysis conducted on geographies consisting of 82,682,365 people shows no correlation between the proportion of Alsatians and percentage of population with at least college, 1 year or more education in the United States with a correlation coefficient (R) of -0.012 and weighted average of 61.3%, a difference of 6.4%.
College, 1 year or more Correlation Summary
| Measurement | Immigrants from Panama | Alsatian |
| Minimum | 25.5% | 28.5% |
| Maximum | 100.0% | 87.3% |
| Range | 74.5% | 58.8% |
| Mean | 50.5% | 56.7% |
| Median | 54.2% | 55.8% |
| Interquartile 25% (IQ1) | 37.8% | 47.4% |
| Interquartile 75% (IQ3) | 58.5% | 64.4% |
| Interquartile Range (IQR) | 20.7% | 17.1% |
| Standard Deviation (Sample) | 16.7% | 13.3% |
| Standard Deviation (Population) | 16.5% | 13.0% |
Similar Demographics by College, 1 year or more
Demographics Similar to Immigrants from Panama by College, 1 year or more
In terms of college, 1 year or more, the demographic groups most similar to Immigrants from Panama are Native Hawaiian (57.6%, a difference of 0.0%), White/Caucasian (57.6%, a difference of 0.070%), Immigrants from Costa Rica (57.5%, a difference of 0.19%), Immigrants from Peru (57.7%, a difference of 0.24%), and Immigrants from Ghana (57.4%, a difference of 0.25%).
| Demographics | Rating | Rank | College, 1 year or more |
| Tsimshian | 13.5 /100 | #210 | Poor 57.9% |
| Immigrants | Nigeria | 13.3 /100 | #211 | Poor 57.9% |
| Immigrants | Senegal | 11.8 /100 | #212 | Poor 57.8% |
| French Canadians | 11.8 /100 | #213 | Poor 57.8% |
| Immigrants | Colombia | 11.6 /100 | #214 | Poor 57.8% |
| Tongans | 11.6 /100 | #215 | Poor 57.8% |
| Immigrants | Peru | 10.6 /100 | #216 | Poor 57.7% |
| Immigrants | Panama | 9.1 /100 | #217 | Tragic 57.6% |
| Native Hawaiians | 9.0 /100 | #218 | Tragic 57.6% |
| Whites/Caucasians | 8.7 /100 | #219 | Tragic 57.6% |
| Immigrants | Costa Rica | 8.0 /100 | #220 | Tragic 57.5% |
| Immigrants | Ghana | 7.7 /100 | #221 | Tragic 57.4% |
| Sub-Saharan Africans | 6.1 /100 | #222 | Tragic 57.3% |
| Portuguese | 5.4 /100 | #223 | Tragic 57.2% |
| Hmong | 5.4 /100 | #224 | Tragic 57.2% |
Demographics Similar to Alsatians by College, 1 year or more
In terms of college, 1 year or more, the demographic groups most similar to Alsatians are Immigrants from Eastern Africa (61.2%, a difference of 0.030%), Immigrants from Italy (61.2%, a difference of 0.030%), Immigrants from Syria (61.3%, a difference of 0.050%), Ugandan (61.2%, a difference of 0.090%), and Venezuelan (61.3%, a difference of 0.13%).
| Demographics | Rating | Rank | College, 1 year or more |
| Assyrians/Chaldeans/Syriacs | 93.3 /100 | #119 | Exceptional 61.5% |
| Pakistanis | 93.2 /100 | #120 | Exceptional 61.5% |
| Immigrants | Jordan | 92.7 /100 | #121 | Exceptional 61.4% |
| Immigrants | Chile | 92.3 /100 | #122 | Exceptional 61.4% |
| Serbians | 92.2 /100 | #123 | Exceptional 61.4% |
| Venezuelans | 92.1 /100 | #124 | Exceptional 61.3% |
| Immigrants | Syria | 91.6 /100 | #125 | Exceptional 61.3% |
| Alsatians | 91.3 /100 | #126 | Exceptional 61.3% |
| Immigrants | Eastern Africa | 91.1 /100 | #127 | Exceptional 61.2% |
| Immigrants | Italy | 91.1 /100 | #128 | Exceptional 61.2% |
| Ugandans | 90.7 /100 | #129 | Exceptional 61.2% |
| Italians | 89.5 /100 | #130 | Excellent 61.1% |
| Immigrants | Morocco | 89.5 /100 | #131 | Excellent 61.1% |
| Scandinavians | 88.2 /100 | #132 | Excellent 61.0% |
| Immigrants | Uzbekistan | 88.0 /100 | #133 | Excellent 61.0% |