Dutch West Indian vs Alsatian College, 1 year or more
COMPARE
Dutch West Indian
Alsatian
College, 1 year or more
College, 1 year or more Comparison
Dutch West Indians
Alsatians
50.5%
COLLEGE, 1 YEAR OR MORE
0.0/ 100
METRIC RATING
328th/ 347
METRIC RANK
61.3%
COLLEGE, 1 YEAR OR MORE
91.3/ 100
METRIC RATING
126th/ 347
METRIC RANK
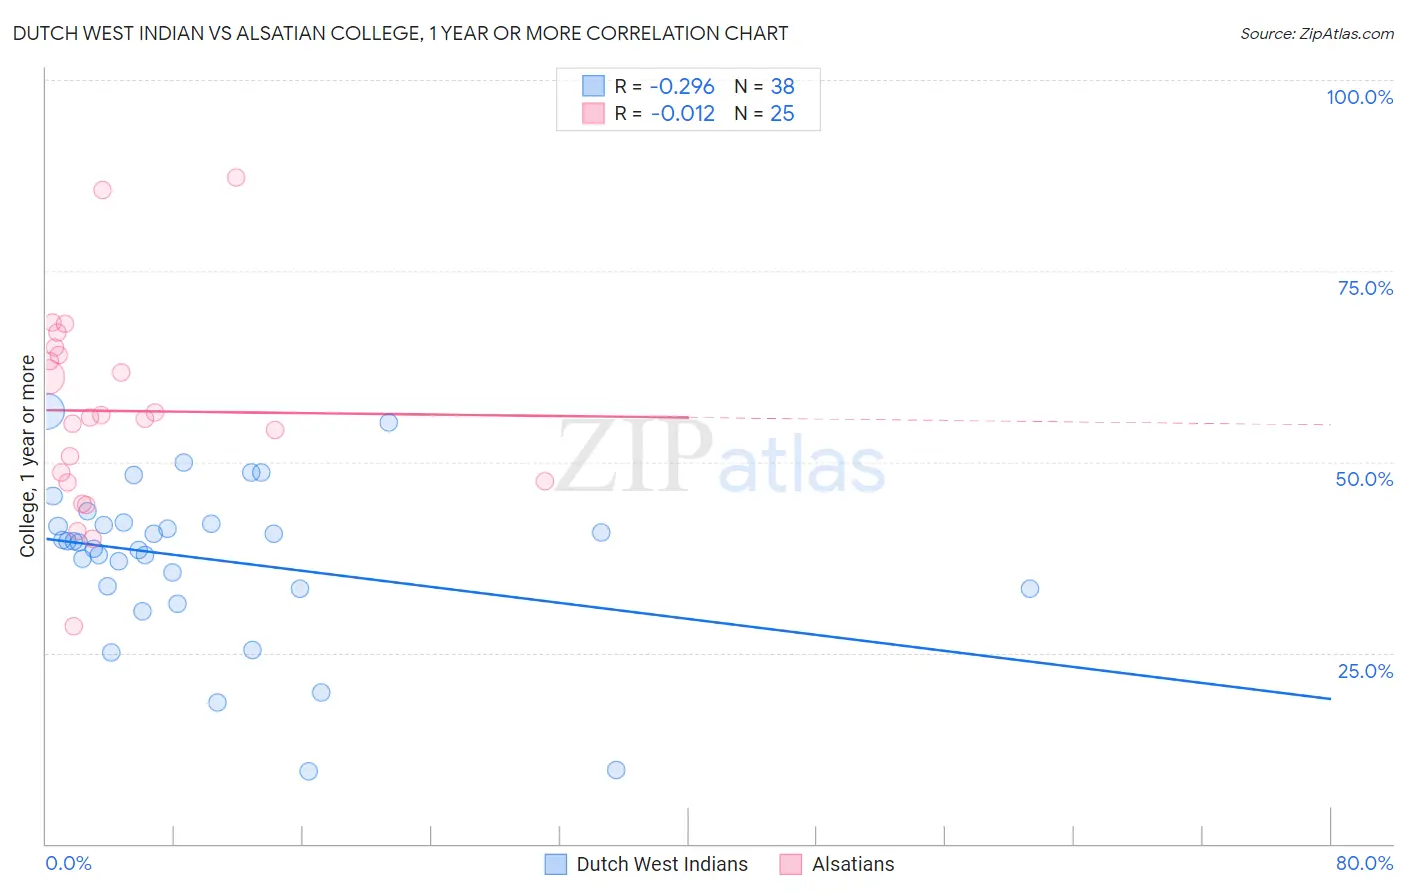
Dutch West Indian vs Alsatian College, 1 year or more Correlation Chart
The statistical analysis conducted on geographies consisting of 85,776,098 people shows a weak negative correlation between the proportion of Dutch West Indians and percentage of population with at least college, 1 year or more education in the United States with a correlation coefficient (R) of -0.296 and weighted average of 50.5%. Similarly, the statistical analysis conducted on geographies consisting of 82,682,365 people shows no correlation between the proportion of Alsatians and percentage of population with at least college, 1 year or more education in the United States with a correlation coefficient (R) of -0.012 and weighted average of 61.3%, a difference of 21.3%.
College, 1 year or more Correlation Summary
| Measurement | Dutch West Indian | Alsatian |
| Minimum | 9.5% | 28.5% |
| Maximum | 56.6% | 87.3% |
| Range | 47.1% | 58.8% |
| Mean | 37.3% | 56.7% |
| Median | 39.5% | 55.8% |
| Interquartile 25% (IQ1) | 33.3% | 47.4% |
| Interquartile 75% (IQ3) | 41.8% | 64.4% |
| Interquartile Range (IQR) | 8.5% | 17.1% |
| Standard Deviation (Sample) | 10.5% | 13.3% |
| Standard Deviation (Population) | 10.4% | 13.0% |
Similar Demographics by College, 1 year or more
Demographics Similar to Dutch West Indians by College, 1 year or more
In terms of college, 1 year or more, the demographic groups most similar to Dutch West Indians are Menominee (50.6%, a difference of 0.12%), Dominican (50.6%, a difference of 0.15%), Immigrants from Latin America (50.7%, a difference of 0.33%), Immigrants from Cuba (50.7%, a difference of 0.36%), and Immigrants from Guatemala (50.7%, a difference of 0.37%).
| Demographics | Rating | Rank | College, 1 year or more |
| Hopi | 0.0 /100 | #321 | Tragic 50.9% |
| Navajo | 0.0 /100 | #322 | Tragic 50.8% |
| Immigrants | Guatemala | 0.0 /100 | #323 | Tragic 50.7% |
| Immigrants | Cuba | 0.0 /100 | #324 | Tragic 50.7% |
| Immigrants | Latin America | 0.0 /100 | #325 | Tragic 50.7% |
| Dominicans | 0.0 /100 | #326 | Tragic 50.6% |
| Menominee | 0.0 /100 | #327 | Tragic 50.6% |
| Dutch West Indians | 0.0 /100 | #328 | Tragic 50.5% |
| Cape Verdeans | 0.0 /100 | #329 | Tragic 50.3% |
| Natives/Alaskans | 0.0 /100 | #330 | Tragic 50.2% |
| Immigrants | Yemen | 0.0 /100 | #331 | Tragic 50.0% |
| Mexicans | 0.0 /100 | #332 | Tragic 49.2% |
| Immigrants | Dominican Republic | 0.0 /100 | #333 | Tragic 49.1% |
| Lumbee | 0.0 /100 | #334 | Tragic 48.9% |
| Yuman | 0.0 /100 | #335 | Tragic 48.7% |
Demographics Similar to Alsatians by College, 1 year or more
In terms of college, 1 year or more, the demographic groups most similar to Alsatians are Immigrants from Eastern Africa (61.2%, a difference of 0.030%), Immigrants from Italy (61.2%, a difference of 0.030%), Immigrants from Syria (61.3%, a difference of 0.050%), Ugandan (61.2%, a difference of 0.090%), and Venezuelan (61.3%, a difference of 0.13%).
| Demographics | Rating | Rank | College, 1 year or more |
| Assyrians/Chaldeans/Syriacs | 93.3 /100 | #119 | Exceptional 61.5% |
| Pakistanis | 93.2 /100 | #120 | Exceptional 61.5% |
| Immigrants | Jordan | 92.7 /100 | #121 | Exceptional 61.4% |
| Immigrants | Chile | 92.3 /100 | #122 | Exceptional 61.4% |
| Serbians | 92.2 /100 | #123 | Exceptional 61.4% |
| Venezuelans | 92.1 /100 | #124 | Exceptional 61.3% |
| Immigrants | Syria | 91.6 /100 | #125 | Exceptional 61.3% |
| Alsatians | 91.3 /100 | #126 | Exceptional 61.3% |
| Immigrants | Eastern Africa | 91.1 /100 | #127 | Exceptional 61.2% |
| Immigrants | Italy | 91.1 /100 | #128 | Exceptional 61.2% |
| Ugandans | 90.7 /100 | #129 | Exceptional 61.2% |
| Italians | 89.5 /100 | #130 | Excellent 61.1% |
| Immigrants | Morocco | 89.5 /100 | #131 | Excellent 61.1% |
| Scandinavians | 88.2 /100 | #132 | Excellent 61.0% |
| Immigrants | Uzbekistan | 88.0 /100 | #133 | Excellent 61.0% |