South African vs Tongan College, Under 1 year
COMPARE
South African
Tongan
College, Under 1 year
College, Under 1 year Comparison
South Africans
Tongans
69.7%
COLLEGE, UNDER 1 YEAR
99.7/ 100
METRIC RATING
53rd/ 347
METRIC RANK
64.5%
COLLEGE, UNDER 1 YEAR
21.2/ 100
METRIC RATING
196th/ 347
METRIC RANK
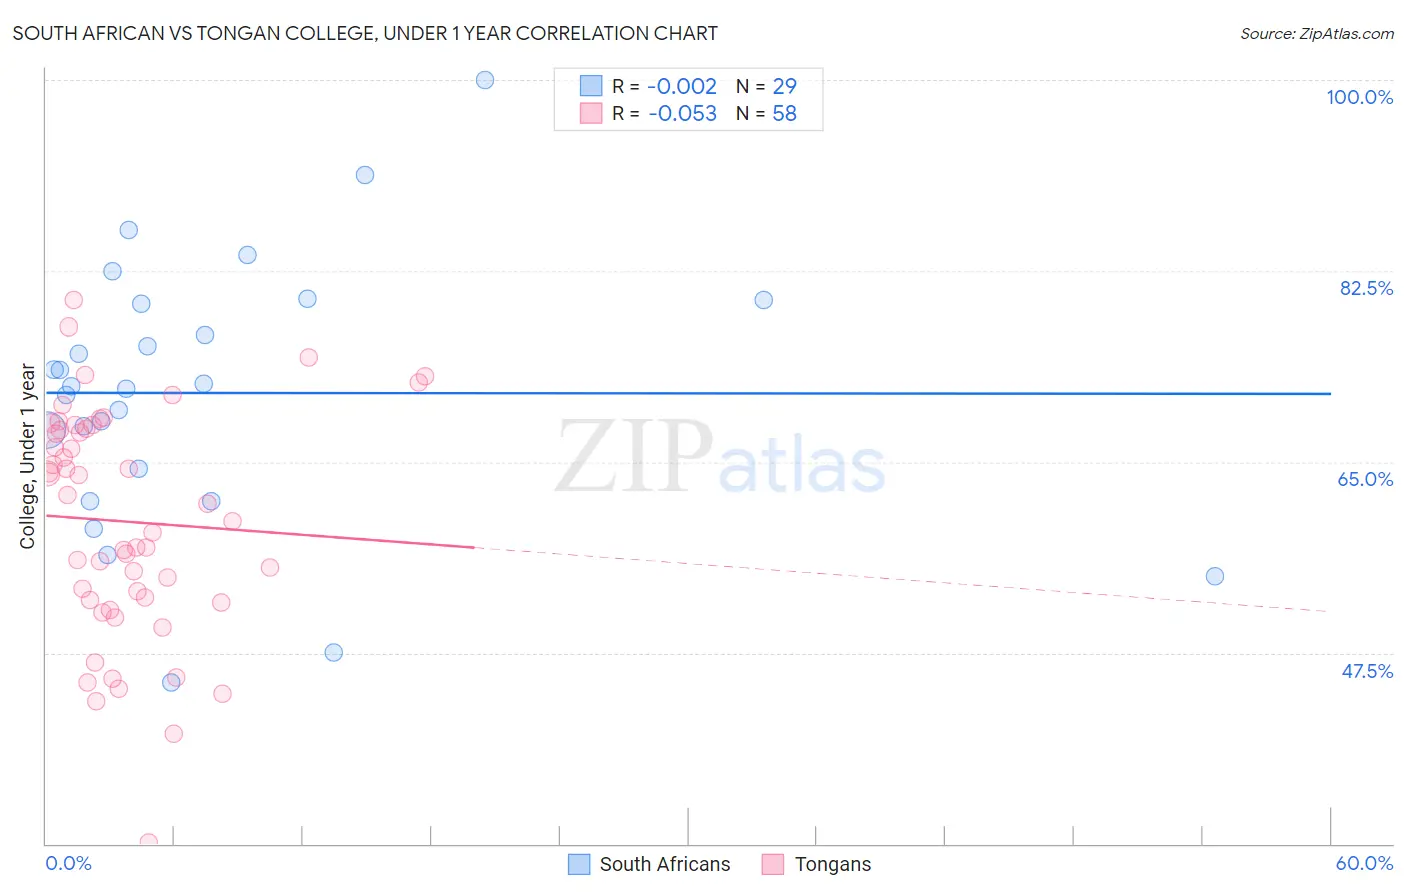
South African vs Tongan College, Under 1 year Correlation Chart
The statistical analysis conducted on geographies consisting of 182,603,987 people shows no correlation between the proportion of South Africans and percentage of population with at least college, under 1 year education in the United States with a correlation coefficient (R) of -0.002 and weighted average of 69.7%. Similarly, the statistical analysis conducted on geographies consisting of 102,908,759 people shows a slight negative correlation between the proportion of Tongans and percentage of population with at least college, under 1 year education in the United States with a correlation coefficient (R) of -0.053 and weighted average of 64.5%, a difference of 8.1%.
College, Under 1 year Correlation Summary
| Measurement | South African | Tongan |
| Minimum | 44.7% | 30.2% |
| Maximum | 100.0% | 79.8% |
| Range | 55.3% | 49.7% |
| Mean | 71.3% | 59.5% |
| Median | 71.9% | 60.3% |
| Interquartile 25% (IQ1) | 62.9% | 52.3% |
| Interquartile 75% (IQ3) | 79.7% | 68.0% |
| Interquartile Range (IQR) | 16.7% | 15.7% |
| Standard Deviation (Sample) | 12.3% | 10.4% |
| Standard Deviation (Population) | 12.1% | 10.4% |
Similar Demographics by College, Under 1 year
Demographics Similar to South Africans by College, Under 1 year
In terms of college, under 1 year, the demographic groups most similar to South Africans are Immigrants from Czechoslovakia (69.6%, a difference of 0.12%), Maltese (69.5%, a difference of 0.22%), Immigrants from Russia (69.9%, a difference of 0.27%), Mongolian (69.9%, a difference of 0.30%), and Zimbabwean (69.9%, a difference of 0.33%).
| Demographics | Rating | Rank | College, Under 1 year |
| Immigrants | Latvia | 99.9 /100 | #46 | Exceptional 70.1% |
| Immigrants | Bulgaria | 99.8 /100 | #47 | Exceptional 70.0% |
| Immigrants | Netherlands | 99.8 /100 | #48 | Exceptional 70.0% |
| Immigrants | Austria | 99.8 /100 | #49 | Exceptional 70.0% |
| Zimbabweans | 99.8 /100 | #50 | Exceptional 69.9% |
| Mongolians | 99.8 /100 | #51 | Exceptional 69.9% |
| Immigrants | Russia | 99.8 /100 | #52 | Exceptional 69.9% |
| South Africans | 99.7 /100 | #53 | Exceptional 69.7% |
| Immigrants | Czechoslovakia | 99.7 /100 | #54 | Exceptional 69.6% |
| Maltese | 99.7 /100 | #55 | Exceptional 69.5% |
| Immigrants | Scotland | 99.6 /100 | #56 | Exceptional 69.4% |
| Asians | 99.6 /100 | #57 | Exceptional 69.4% |
| Immigrants | Malaysia | 99.6 /100 | #58 | Exceptional 69.3% |
| Immigrants | Serbia | 99.5 /100 | #59 | Exceptional 69.3% |
| Immigrants | Asia | 99.5 /100 | #60 | Exceptional 69.2% |
Demographics Similar to Tongans by College, Under 1 year
In terms of college, under 1 year, the demographic groups most similar to Tongans are Immigrants from South Eastern Asia (64.5%, a difference of 0.050%), Costa Rican (64.4%, a difference of 0.11%), Immigrants from Cameroon (64.6%, a difference of 0.21%), Tsimshian (64.3%, a difference of 0.24%), and Panamanian (64.3%, a difference of 0.31%).
| Demographics | Rating | Rank | College, Under 1 year |
| Spanish | 31.6 /100 | #189 | Fair 64.9% |
| Immigrants | Philippines | 30.1 /100 | #190 | Fair 64.8% |
| Immigrants | Armenia | 28.1 /100 | #191 | Fair 64.7% |
| Immigrants | Thailand | 27.0 /100 | #192 | Fair 64.7% |
| Slovaks | 26.7 /100 | #193 | Fair 64.7% |
| Immigrants | Cameroon | 24.6 /100 | #194 | Fair 64.6% |
| Immigrants | South Eastern Asia | 22.1 /100 | #195 | Fair 64.5% |
| Tongans | 21.2 /100 | #196 | Fair 64.5% |
| Costa Ricans | 19.6 /100 | #197 | Poor 64.4% |
| Tsimshian | 17.9 /100 | #198 | Poor 64.3% |
| Panamanians | 17.0 /100 | #199 | Poor 64.3% |
| Nigerians | 16.7 /100 | #200 | Poor 64.3% |
| French Canadians | 16.3 /100 | #201 | Poor 64.2% |
| South Americans | 16.2 /100 | #202 | Poor 64.2% |
| Uruguayans | 15.6 /100 | #203 | Poor 64.2% |