South African vs Ukrainian College, Under 1 year
COMPARE
South African
Ukrainian
College, Under 1 year
College, Under 1 year Comparison
South Africans
Ukrainians
69.7%
COLLEGE, UNDER 1 YEAR
99.7/ 100
METRIC RATING
53rd/ 347
METRIC RANK
67.7%
COLLEGE, UNDER 1 YEAR
95.8/ 100
METRIC RATING
111th/ 347
METRIC RANK
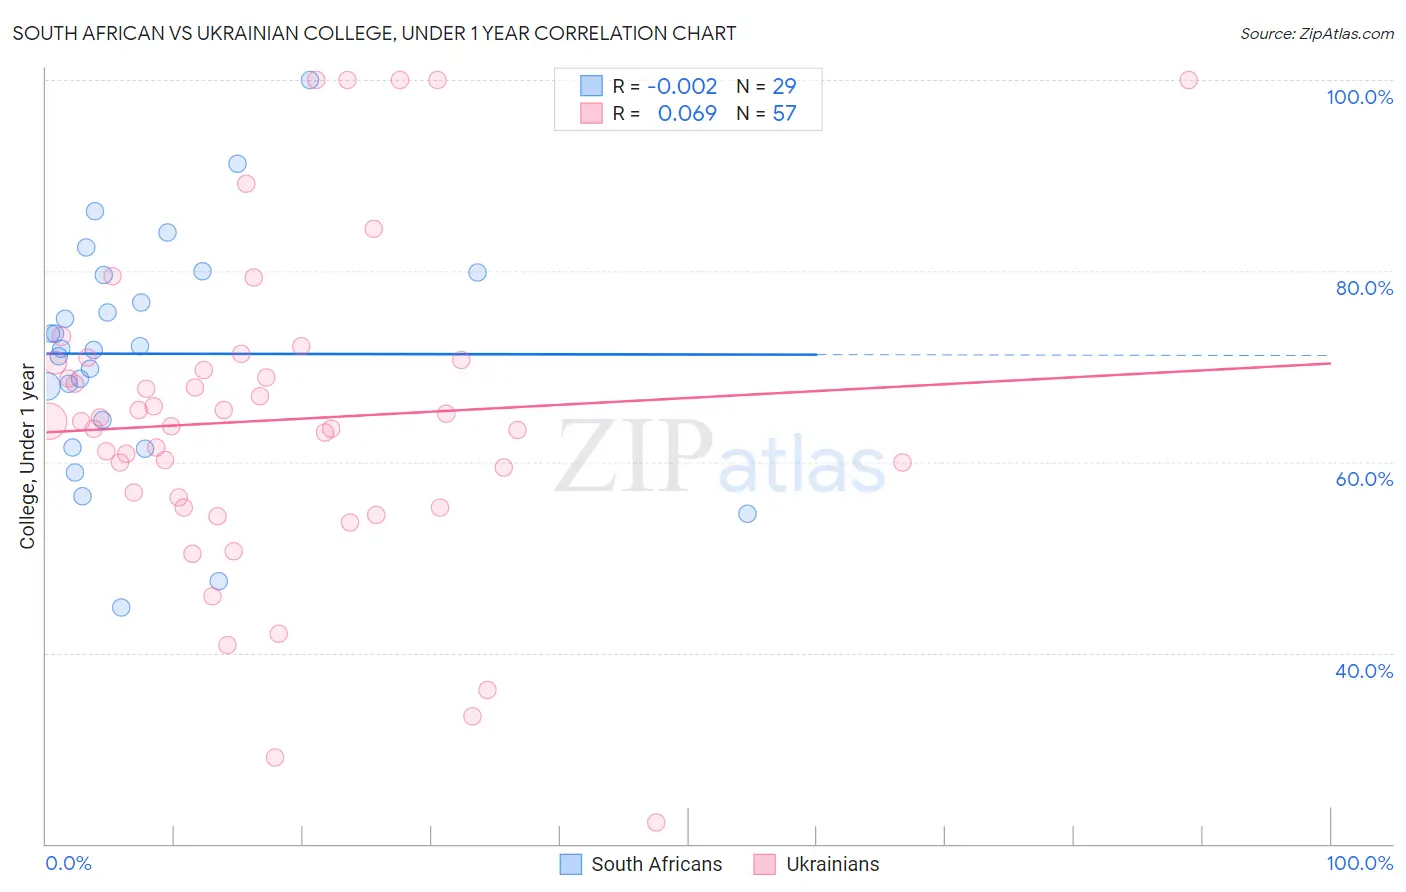
South African vs Ukrainian College, Under 1 year Correlation Chart
The statistical analysis conducted on geographies consisting of 182,603,987 people shows no correlation between the proportion of South Africans and percentage of population with at least college, under 1 year education in the United States with a correlation coefficient (R) of -0.002 and weighted average of 69.7%. Similarly, the statistical analysis conducted on geographies consisting of 448,695,066 people shows a slight positive correlation between the proportion of Ukrainians and percentage of population with at least college, under 1 year education in the United States with a correlation coefficient (R) of 0.069 and weighted average of 67.7%, a difference of 3.0%.
College, Under 1 year Correlation Summary
| Measurement | South African | Ukrainian |
| Minimum | 44.7% | 22.2% |
| Maximum | 100.0% | 100.0% |
| Range | 55.3% | 77.8% |
| Mean | 71.3% | 64.4% |
| Median | 71.9% | 64.2% |
| Interquartile 25% (IQ1) | 62.9% | 55.7% |
| Interquartile 75% (IQ3) | 79.7% | 70.5% |
| Interquartile Range (IQR) | 16.7% | 14.8% |
| Standard Deviation (Sample) | 12.3% | 16.6% |
| Standard Deviation (Population) | 12.1% | 16.5% |
Similar Demographics by College, Under 1 year
Demographics Similar to South Africans by College, Under 1 year
In terms of college, under 1 year, the demographic groups most similar to South Africans are Immigrants from Czechoslovakia (69.6%, a difference of 0.12%), Maltese (69.5%, a difference of 0.22%), Immigrants from Russia (69.9%, a difference of 0.27%), Mongolian (69.9%, a difference of 0.30%), and Zimbabwean (69.9%, a difference of 0.33%).
| Demographics | Rating | Rank | College, Under 1 year |
| Immigrants | Latvia | 99.9 /100 | #46 | Exceptional 70.1% |
| Immigrants | Bulgaria | 99.8 /100 | #47 | Exceptional 70.0% |
| Immigrants | Netherlands | 99.8 /100 | #48 | Exceptional 70.0% |
| Immigrants | Austria | 99.8 /100 | #49 | Exceptional 70.0% |
| Zimbabweans | 99.8 /100 | #50 | Exceptional 69.9% |
| Mongolians | 99.8 /100 | #51 | Exceptional 69.9% |
| Immigrants | Russia | 99.8 /100 | #52 | Exceptional 69.9% |
| South Africans | 99.7 /100 | #53 | Exceptional 69.7% |
| Immigrants | Czechoslovakia | 99.7 /100 | #54 | Exceptional 69.6% |
| Maltese | 99.7 /100 | #55 | Exceptional 69.5% |
| Immigrants | Scotland | 99.6 /100 | #56 | Exceptional 69.4% |
| Asians | 99.6 /100 | #57 | Exceptional 69.4% |
| Immigrants | Malaysia | 99.6 /100 | #58 | Exceptional 69.3% |
| Immigrants | Serbia | 99.5 /100 | #59 | Exceptional 69.3% |
| Immigrants | Asia | 99.5 /100 | #60 | Exceptional 69.2% |
Demographics Similar to Ukrainians by College, Under 1 year
In terms of college, under 1 year, the demographic groups most similar to Ukrainians are Scandinavian (67.7%, a difference of 0.0%), Assyrian/Chaldean/Syriac (67.7%, a difference of 0.0%), Macedonian (67.6%, a difference of 0.020%), Syrian (67.6%, a difference of 0.040%), and Immigrants from Egypt (67.7%, a difference of 0.060%).
| Demographics | Rating | Rank | College, Under 1 year |
| Immigrants | Western Asia | 96.6 /100 | #104 | Exceptional 67.8% |
| Afghans | 96.6 /100 | #105 | Exceptional 67.8% |
| Immigrants | Croatia | 96.6 /100 | #106 | Exceptional 67.8% |
| Austrians | 96.4 /100 | #107 | Exceptional 67.8% |
| Immigrants | Egypt | 96.0 /100 | #108 | Exceptional 67.7% |
| Scandinavians | 95.8 /100 | #109 | Exceptional 67.7% |
| Assyrians/Chaldeans/Syriacs | 95.8 /100 | #110 | Exceptional 67.7% |
| Ukrainians | 95.8 /100 | #111 | Exceptional 67.7% |
| Macedonians | 95.7 /100 | #112 | Exceptional 67.6% |
| Syrians | 95.6 /100 | #113 | Exceptional 67.6% |
| Chileans | 95.3 /100 | #114 | Exceptional 67.6% |
| Basques | 95.2 /100 | #115 | Exceptional 67.6% |
| Immigrants | Nepal | 94.9 /100 | #116 | Exceptional 67.5% |
| Pakistanis | 94.8 /100 | #117 | Exceptional 67.5% |
| Immigrants | Ukraine | 94.7 /100 | #118 | Exceptional 67.5% |