Immigrants from Bulgaria vs Tongan College, Under 1 year
COMPARE
Immigrants from Bulgaria
Tongan
College, Under 1 year
College, Under 1 year Comparison
Immigrants from Bulgaria
Tongans
70.0%
COLLEGE, UNDER 1 YEAR
99.8/ 100
METRIC RATING
47th/ 347
METRIC RANK
64.5%
COLLEGE, UNDER 1 YEAR
21.2/ 100
METRIC RATING
196th/ 347
METRIC RANK
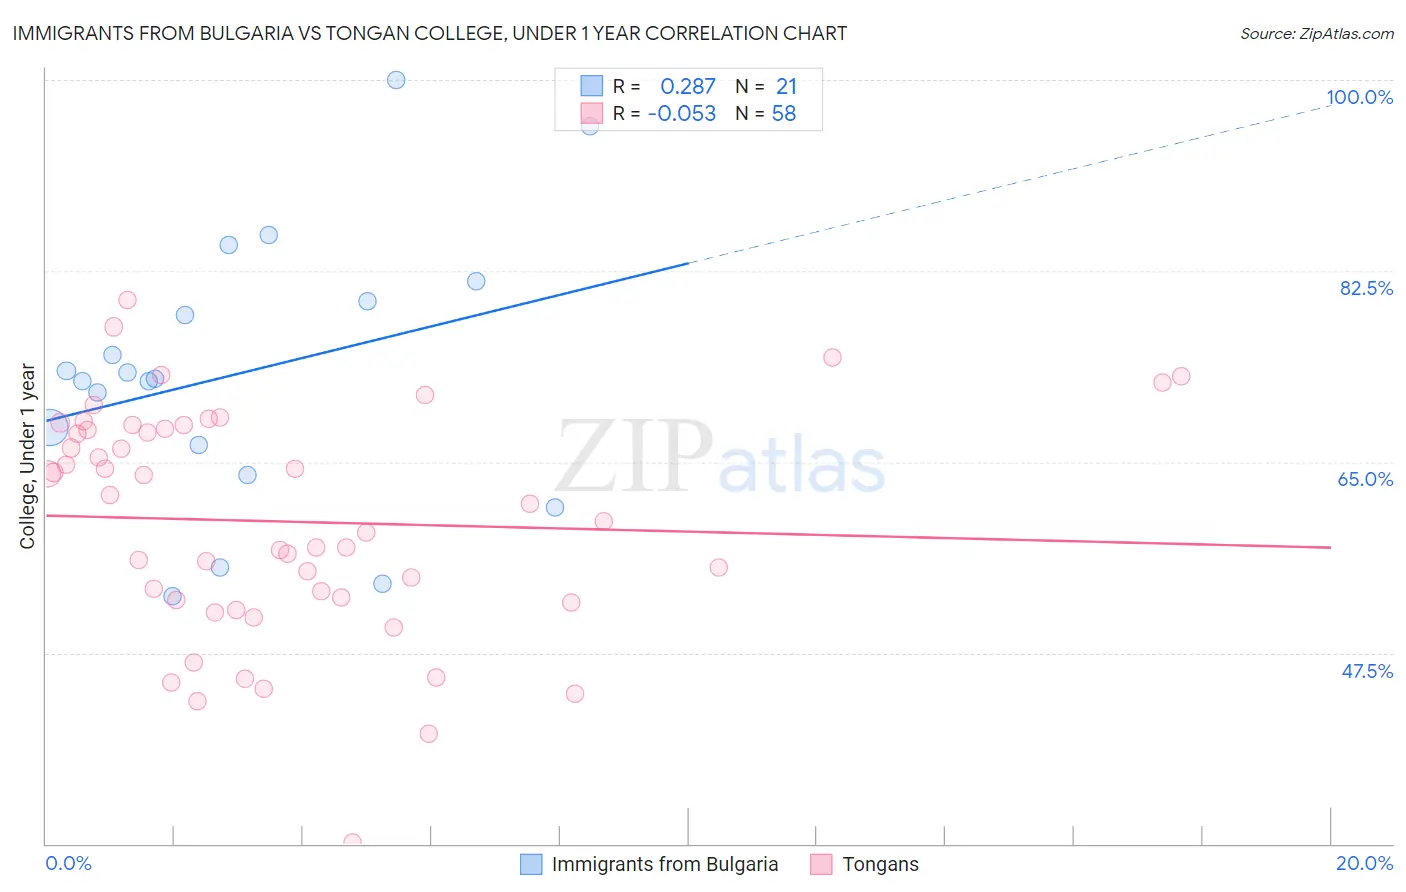
Immigrants from Bulgaria vs Tongan College, Under 1 year Correlation Chart
The statistical analysis conducted on geographies consisting of 172,550,092 people shows a weak positive correlation between the proportion of Immigrants from Bulgaria and percentage of population with at least college, under 1 year education in the United States with a correlation coefficient (R) of 0.287 and weighted average of 70.0%. Similarly, the statistical analysis conducted on geographies consisting of 102,908,759 people shows a slight negative correlation between the proportion of Tongans and percentage of population with at least college, under 1 year education in the United States with a correlation coefficient (R) of -0.053 and weighted average of 64.5%, a difference of 8.6%.
College, Under 1 year Correlation Summary
| Measurement | Immigrants from Bulgaria | Tongan |
| Minimum | 52.7% | 30.2% |
| Maximum | 100.0% | 79.8% |
| Range | 47.3% | 49.7% |
| Mean | 73.2% | 59.5% |
| Median | 72.6% | 60.3% |
| Interquartile 25% (IQ1) | 65.2% | 52.3% |
| Interquartile 75% (IQ3) | 80.6% | 68.0% |
| Interquartile Range (IQR) | 15.4% | 15.7% |
| Standard Deviation (Sample) | 12.4% | 10.4% |
| Standard Deviation (Population) | 12.1% | 10.4% |
Similar Demographics by College, Under 1 year
Demographics Similar to Immigrants from Bulgaria by College, Under 1 year
In terms of college, under 1 year, the demographic groups most similar to Immigrants from Bulgaria are Immigrants from Netherlands (70.0%, a difference of 0.060%), Immigrants from Austria (70.0%, a difference of 0.10%), Immigrants from Latvia (70.1%, a difference of 0.11%), Zimbabwean (69.9%, a difference of 0.22%), and Immigrants from Norway (70.2%, a difference of 0.23%).
| Demographics | Rating | Rank | College, Under 1 year |
| Immigrants | Turkey | 99.9 /100 | #40 | Exceptional 70.3% |
| Immigrants | Kuwait | 99.9 /100 | #41 | Exceptional 70.3% |
| Immigrants | Lithuania | 99.9 /100 | #42 | Exceptional 70.3% |
| Israelis | 99.9 /100 | #43 | Exceptional 70.2% |
| New Zealanders | 99.9 /100 | #44 | Exceptional 70.2% |
| Immigrants | Norway | 99.9 /100 | #45 | Exceptional 70.2% |
| Immigrants | Latvia | 99.9 /100 | #46 | Exceptional 70.1% |
| Immigrants | Bulgaria | 99.8 /100 | #47 | Exceptional 70.0% |
| Immigrants | Netherlands | 99.8 /100 | #48 | Exceptional 70.0% |
| Immigrants | Austria | 99.8 /100 | #49 | Exceptional 70.0% |
| Zimbabweans | 99.8 /100 | #50 | Exceptional 69.9% |
| Mongolians | 99.8 /100 | #51 | Exceptional 69.9% |
| Immigrants | Russia | 99.8 /100 | #52 | Exceptional 69.9% |
| South Africans | 99.7 /100 | #53 | Exceptional 69.7% |
| Immigrants | Czechoslovakia | 99.7 /100 | #54 | Exceptional 69.6% |
Demographics Similar to Tongans by College, Under 1 year
In terms of college, under 1 year, the demographic groups most similar to Tongans are Immigrants from South Eastern Asia (64.5%, a difference of 0.050%), Costa Rican (64.4%, a difference of 0.11%), Immigrants from Cameroon (64.6%, a difference of 0.21%), Tsimshian (64.3%, a difference of 0.24%), and Panamanian (64.3%, a difference of 0.31%).
| Demographics | Rating | Rank | College, Under 1 year |
| Spanish | 31.6 /100 | #189 | Fair 64.9% |
| Immigrants | Philippines | 30.1 /100 | #190 | Fair 64.8% |
| Immigrants | Armenia | 28.1 /100 | #191 | Fair 64.7% |
| Immigrants | Thailand | 27.0 /100 | #192 | Fair 64.7% |
| Slovaks | 26.7 /100 | #193 | Fair 64.7% |
| Immigrants | Cameroon | 24.6 /100 | #194 | Fair 64.6% |
| Immigrants | South Eastern Asia | 22.1 /100 | #195 | Fair 64.5% |
| Tongans | 21.2 /100 | #196 | Fair 64.5% |
| Costa Ricans | 19.6 /100 | #197 | Poor 64.4% |
| Tsimshian | 17.9 /100 | #198 | Poor 64.3% |
| Panamanians | 17.0 /100 | #199 | Poor 64.3% |
| Nigerians | 16.7 /100 | #200 | Poor 64.3% |
| French Canadians | 16.3 /100 | #201 | Poor 64.2% |
| South Americans | 16.2 /100 | #202 | Poor 64.2% |
| Uruguayans | 15.6 /100 | #203 | Poor 64.2% |