South African vs Sioux College, Under 1 year
COMPARE
South African
Sioux
College, Under 1 year
College, Under 1 year Comparison
South Africans
Sioux
69.7%
COLLEGE, UNDER 1 YEAR
99.7/ 100
METRIC RATING
53rd/ 347
METRIC RANK
59.4%
COLLEGE, UNDER 1 YEAR
0.0/ 100
METRIC RATING
287th/ 347
METRIC RANK
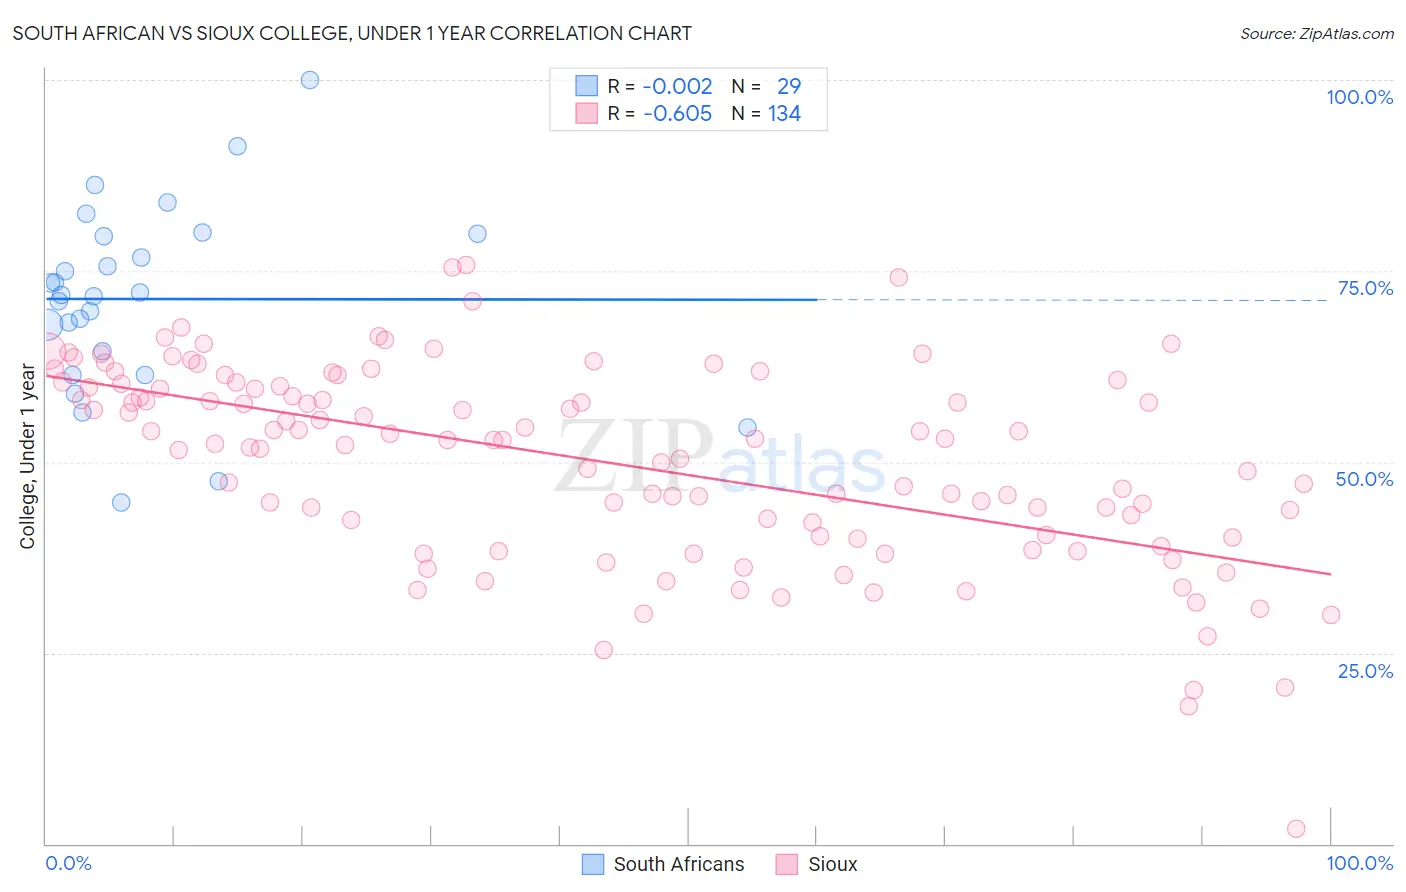
South African vs Sioux College, Under 1 year Correlation Chart
The statistical analysis conducted on geographies consisting of 182,603,987 people shows no correlation between the proportion of South Africans and percentage of population with at least college, under 1 year education in the United States with a correlation coefficient (R) of -0.002 and weighted average of 69.7%. Similarly, the statistical analysis conducted on geographies consisting of 234,200,116 people shows a significant negative correlation between the proportion of Sioux and percentage of population with at least college, under 1 year education in the United States with a correlation coefficient (R) of -0.605 and weighted average of 59.4%, a difference of 17.2%.
College, Under 1 year Correlation Summary
| Measurement | South African | Sioux |
| Minimum | 44.7% | 2.0% |
| Maximum | 100.0% | 75.8% |
| Range | 55.3% | 73.8% |
| Mean | 71.3% | 50.0% |
| Median | 71.9% | 52.8% |
| Interquartile 25% (IQ1) | 62.9% | 40.2% |
| Interquartile 75% (IQ3) | 79.7% | 59.9% |
| Interquartile Range (IQR) | 16.7% | 19.7% |
| Standard Deviation (Sample) | 12.3% | 12.9% |
| Standard Deviation (Population) | 12.1% | 12.9% |
Similar Demographics by College, Under 1 year
Demographics Similar to South Africans by College, Under 1 year
In terms of college, under 1 year, the demographic groups most similar to South Africans are Immigrants from Czechoslovakia (69.6%, a difference of 0.12%), Maltese (69.5%, a difference of 0.22%), Immigrants from Russia (69.9%, a difference of 0.27%), Mongolian (69.9%, a difference of 0.30%), and Zimbabwean (69.9%, a difference of 0.33%).
| Demographics | Rating | Rank | College, Under 1 year |
| Immigrants | Latvia | 99.9 /100 | #46 | Exceptional 70.1% |
| Immigrants | Bulgaria | 99.8 /100 | #47 | Exceptional 70.0% |
| Immigrants | Netherlands | 99.8 /100 | #48 | Exceptional 70.0% |
| Immigrants | Austria | 99.8 /100 | #49 | Exceptional 70.0% |
| Zimbabweans | 99.8 /100 | #50 | Exceptional 69.9% |
| Mongolians | 99.8 /100 | #51 | Exceptional 69.9% |
| Immigrants | Russia | 99.8 /100 | #52 | Exceptional 69.9% |
| South Africans | 99.7 /100 | #53 | Exceptional 69.7% |
| Immigrants | Czechoslovakia | 99.7 /100 | #54 | Exceptional 69.6% |
| Maltese | 99.7 /100 | #55 | Exceptional 69.5% |
| Immigrants | Scotland | 99.6 /100 | #56 | Exceptional 69.4% |
| Asians | 99.6 /100 | #57 | Exceptional 69.4% |
| Immigrants | Malaysia | 99.6 /100 | #58 | Exceptional 69.3% |
| Immigrants | Serbia | 99.5 /100 | #59 | Exceptional 69.3% |
| Immigrants | Asia | 99.5 /100 | #60 | Exceptional 69.2% |
Demographics Similar to Sioux by College, Under 1 year
In terms of college, under 1 year, the demographic groups most similar to Sioux are Black/African American (59.4%, a difference of 0.10%), British West Indian (59.5%, a difference of 0.17%), Choctaw (59.3%, a difference of 0.17%), Ecuadorian (59.3%, a difference of 0.21%), and Creek (59.3%, a difference of 0.29%).
| Demographics | Rating | Rank | College, Under 1 year |
| Crow | 0.1 /100 | #280 | Tragic 60.2% |
| Cherokee | 0.1 /100 | #281 | Tragic 60.1% |
| Belizeans | 0.1 /100 | #282 | Tragic 60.1% |
| Immigrants | Jamaica | 0.0 /100 | #283 | Tragic 59.7% |
| Immigrants | St. Vincent and the Grenadines | 0.0 /100 | #284 | Tragic 59.6% |
| Paiute | 0.0 /100 | #285 | Tragic 59.6% |
| British West Indians | 0.0 /100 | #286 | Tragic 59.5% |
| Sioux | 0.0 /100 | #287 | Tragic 59.4% |
| Blacks/African Americans | 0.0 /100 | #288 | Tragic 59.4% |
| Choctaw | 0.0 /100 | #289 | Tragic 59.3% |
| Ecuadorians | 0.0 /100 | #290 | Tragic 59.3% |
| Creek | 0.0 /100 | #291 | Tragic 59.3% |
| Nicaraguans | 0.0 /100 | #292 | Tragic 59.2% |
| Seminole | 0.0 /100 | #293 | Tragic 59.1% |
| Immigrants | Belize | 0.0 /100 | #294 | Tragic 59.1% |