Mexican vs Tongan College, Under 1 year
COMPARE
Mexican
Tongan
College, Under 1 year
College, Under 1 year Comparison
Mexicans
Tongans
55.6%
COLLEGE, UNDER 1 YEAR
0.0/ 100
METRIC RATING
330th/ 347
METRIC RANK
64.5%
COLLEGE, UNDER 1 YEAR
21.2/ 100
METRIC RATING
196th/ 347
METRIC RANK
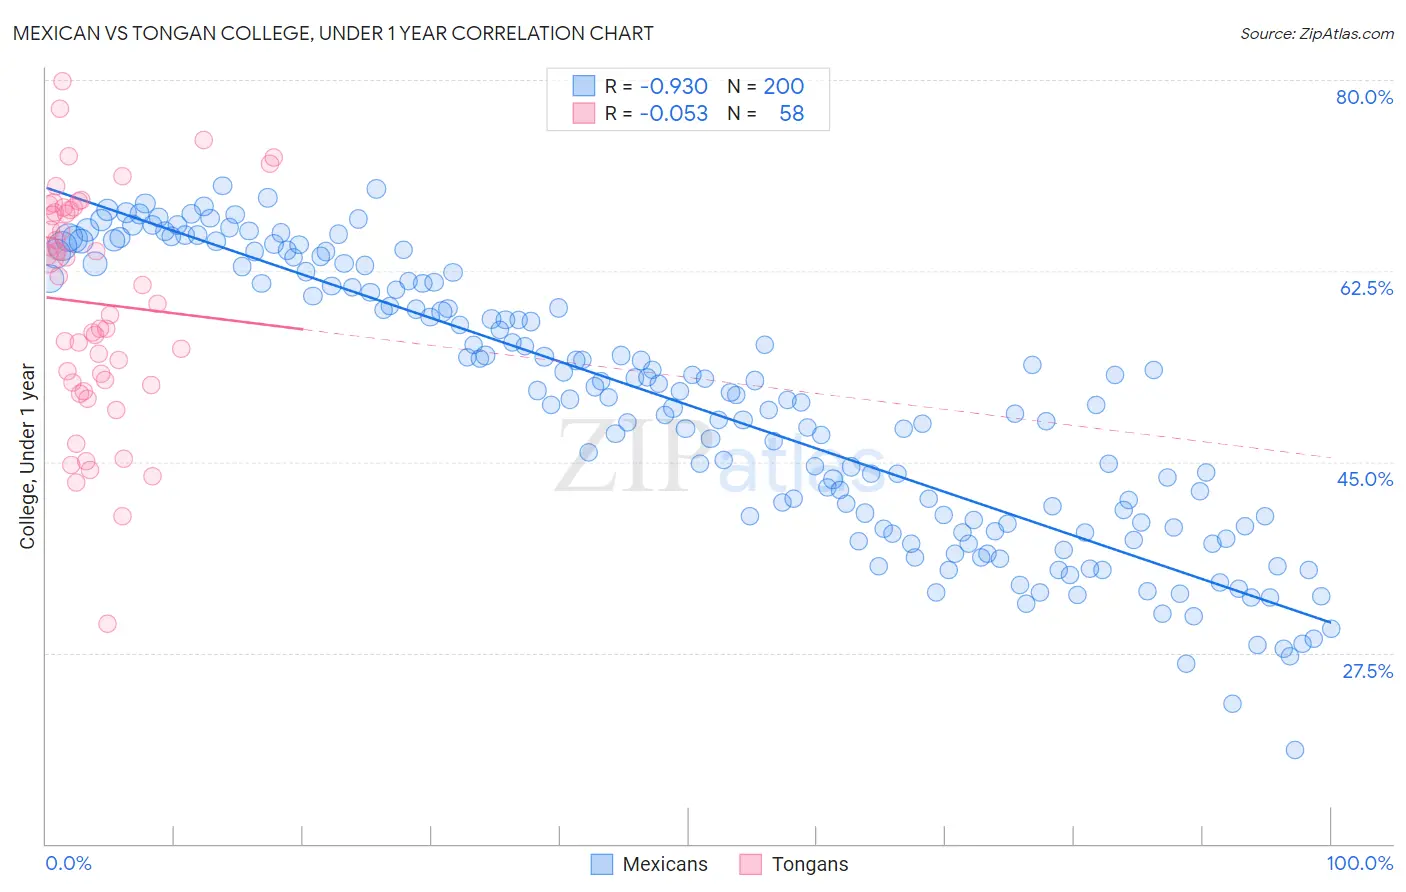
Mexican vs Tongan College, Under 1 year Correlation Chart
The statistical analysis conducted on geographies consisting of 565,321,978 people shows a near-perfect negative correlation between the proportion of Mexicans and percentage of population with at least college, under 1 year education in the United States with a correlation coefficient (R) of -0.930 and weighted average of 55.6%. Similarly, the statistical analysis conducted on geographies consisting of 102,908,759 people shows a slight negative correlation between the proportion of Tongans and percentage of population with at least college, under 1 year education in the United States with a correlation coefficient (R) of -0.053 and weighted average of 64.5%, a difference of 15.9%.
College, Under 1 year Correlation Summary
| Measurement | Mexican | Tongan |
| Minimum | 18.5% | 30.2% |
| Maximum | 70.3% | 79.8% |
| Range | 51.8% | 49.7% |
| Mean | 50.2% | 59.5% |
| Median | 51.0% | 60.3% |
| Interquartile 25% (IQ1) | 39.2% | 52.3% |
| Interquartile 75% (IQ3) | 61.5% | 68.0% |
| Interquartile Range (IQR) | 22.3% | 15.7% |
| Standard Deviation (Sample) | 12.4% | 10.4% |
| Standard Deviation (Population) | 12.4% | 10.4% |
Similar Demographics by College, Under 1 year
Demographics Similar to Mexicans by College, Under 1 year
In terms of college, under 1 year, the demographic groups most similar to Mexicans are Immigrants from Cuba (55.7%, a difference of 0.13%), Dominican (55.5%, a difference of 0.26%), Immigrants from Yemen (55.3%, a difference of 0.67%), Cape Verdean (56.0%, a difference of 0.75%), and Yuman (55.1%, a difference of 0.99%).
| Demographics | Rating | Rank | College, Under 1 year |
| Immigrants | Honduras | 0.0 /100 | #323 | Tragic 56.5% |
| Immigrants | El Salvador | 0.0 /100 | #324 | Tragic 56.4% |
| Immigrants | Latin America | 0.0 /100 | #325 | Tragic 56.3% |
| Navajo | 0.0 /100 | #326 | Tragic 56.3% |
| Immigrants | Guatemala | 0.0 /100 | #327 | Tragic 56.2% |
| Cape Verdeans | 0.0 /100 | #328 | Tragic 56.0% |
| Immigrants | Cuba | 0.0 /100 | #329 | Tragic 55.7% |
| Mexicans | 0.0 /100 | #330 | Tragic 55.6% |
| Dominicans | 0.0 /100 | #331 | Tragic 55.5% |
| Immigrants | Yemen | 0.0 /100 | #332 | Tragic 55.3% |
| Yuman | 0.0 /100 | #333 | Tragic 55.1% |
| Immigrants | Azores | 0.0 /100 | #334 | Tragic 54.7% |
| Inupiat | 0.0 /100 | #335 | Tragic 54.6% |
| Pennsylvania Germans | 0.0 /100 | #336 | Tragic 54.5% |
| Immigrants | Central America | 0.0 /100 | #337 | Tragic 54.4% |
Demographics Similar to Tongans by College, Under 1 year
In terms of college, under 1 year, the demographic groups most similar to Tongans are Immigrants from South Eastern Asia (64.5%, a difference of 0.050%), Costa Rican (64.4%, a difference of 0.11%), Immigrants from Cameroon (64.6%, a difference of 0.21%), Tsimshian (64.3%, a difference of 0.24%), and Panamanian (64.3%, a difference of 0.31%).
| Demographics | Rating | Rank | College, Under 1 year |
| Spanish | 31.6 /100 | #189 | Fair 64.9% |
| Immigrants | Philippines | 30.1 /100 | #190 | Fair 64.8% |
| Immigrants | Armenia | 28.1 /100 | #191 | Fair 64.7% |
| Immigrants | Thailand | 27.0 /100 | #192 | Fair 64.7% |
| Slovaks | 26.7 /100 | #193 | Fair 64.7% |
| Immigrants | Cameroon | 24.6 /100 | #194 | Fair 64.6% |
| Immigrants | South Eastern Asia | 22.1 /100 | #195 | Fair 64.5% |
| Tongans | 21.2 /100 | #196 | Fair 64.5% |
| Costa Ricans | 19.6 /100 | #197 | Poor 64.4% |
| Tsimshian | 17.9 /100 | #198 | Poor 64.3% |
| Panamanians | 17.0 /100 | #199 | Poor 64.3% |
| Nigerians | 16.7 /100 | #200 | Poor 64.3% |
| French Canadians | 16.3 /100 | #201 | Poor 64.2% |
| South Americans | 16.2 /100 | #202 | Poor 64.2% |
| Uruguayans | 15.6 /100 | #203 | Poor 64.2% |