Taiwanese vs Tongan College, Under 1 year
COMPARE
Taiwanese
Tongan
College, Under 1 year
College, Under 1 year Comparison
Taiwanese
Tongans
66.4%
COLLEGE, UNDER 1 YEAR
78.6/ 100
METRIC RATING
148th/ 347
METRIC RANK
64.5%
COLLEGE, UNDER 1 YEAR
21.2/ 100
METRIC RATING
196th/ 347
METRIC RANK
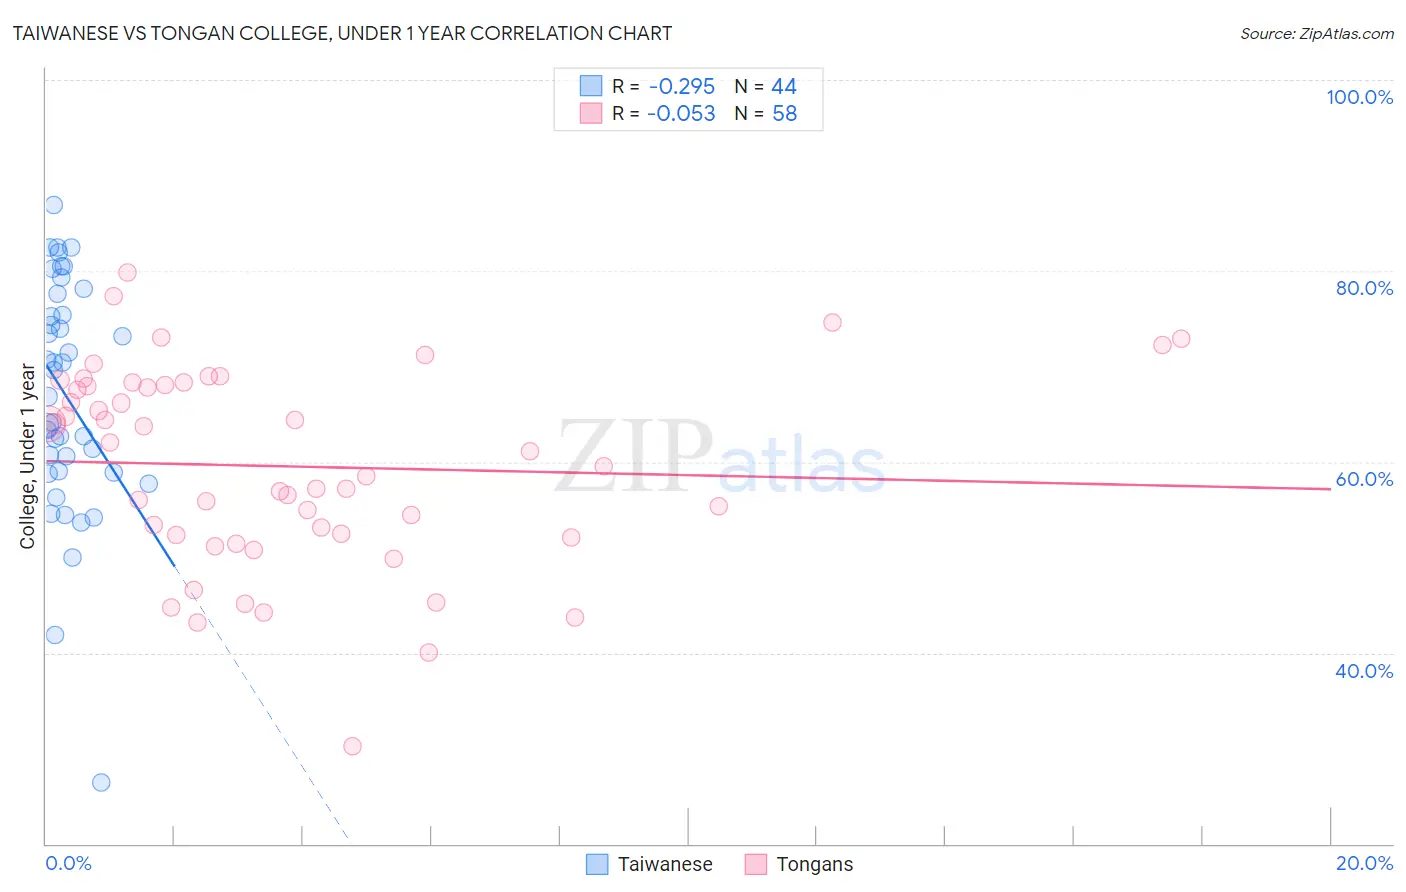
Taiwanese vs Tongan College, Under 1 year Correlation Chart
The statistical analysis conducted on geographies consisting of 31,724,936 people shows a weak negative correlation between the proportion of Taiwanese and percentage of population with at least college, under 1 year education in the United States with a correlation coefficient (R) of -0.295 and weighted average of 66.4%. Similarly, the statistical analysis conducted on geographies consisting of 102,908,759 people shows a slight negative correlation between the proportion of Tongans and percentage of population with at least college, under 1 year education in the United States with a correlation coefficient (R) of -0.053 and weighted average of 64.5%, a difference of 2.9%.
College, Under 1 year Correlation Summary
| Measurement | Taiwanese | Tongan |
| Minimum | 26.4% | 30.2% |
| Maximum | 86.9% | 79.8% |
| Range | 60.6% | 49.7% |
| Mean | 66.9% | 59.5% |
| Median | 68.2% | 60.3% |
| Interquartile 25% (IQ1) | 58.9% | 52.3% |
| Interquartile 75% (IQ3) | 76.5% | 68.0% |
| Interquartile Range (IQR) | 17.6% | 15.7% |
| Standard Deviation (Sample) | 12.3% | 10.4% |
| Standard Deviation (Population) | 12.1% | 10.4% |
Similar Demographics by College, Under 1 year
Demographics Similar to Taiwanese by College, Under 1 year
In terms of college, under 1 year, the demographic groups most similar to Taiwanese are Immigrants from Venezuela (66.3%, a difference of 0.040%), Immigrants from Iraq (66.3%, a difference of 0.090%), Immigrants from Sudan (66.2%, a difference of 0.16%), Kenyan (66.5%, a difference of 0.21%), and Immigrants from Morocco (66.5%, a difference of 0.21%).
| Demographics | Rating | Rank | College, Under 1 year |
| Immigrants | Afghanistan | 85.1 /100 | #141 | Excellent 66.7% |
| English | 82.9 /100 | #142 | Excellent 66.6% |
| Immigrants | Uganda | 82.8 /100 | #143 | Excellent 66.5% |
| Immigrants | Germany | 82.0 /100 | #144 | Excellent 66.5% |
| Immigrants | Kenya | 81.8 /100 | #145 | Excellent 66.5% |
| Kenyans | 81.7 /100 | #146 | Excellent 66.5% |
| Immigrants | Morocco | 81.7 /100 | #147 | Excellent 66.5% |
| Taiwanese | 78.6 /100 | #148 | Good 66.4% |
| Immigrants | Venezuela | 77.9 /100 | #149 | Good 66.3% |
| Immigrants | Iraq | 77.1 /100 | #150 | Good 66.3% |
| Immigrants | Sudan | 76.0 /100 | #151 | Good 66.2% |
| Sudanese | 74.1 /100 | #152 | Good 66.2% |
| Belgians | 73.7 /100 | #153 | Good 66.2% |
| Immigrants | Eritrea | 71.9 /100 | #154 | Good 66.1% |
| Irish | 70.3 /100 | #155 | Good 66.0% |
Demographics Similar to Tongans by College, Under 1 year
In terms of college, under 1 year, the demographic groups most similar to Tongans are Immigrants from South Eastern Asia (64.5%, a difference of 0.050%), Costa Rican (64.4%, a difference of 0.11%), Immigrants from Cameroon (64.6%, a difference of 0.21%), Tsimshian (64.3%, a difference of 0.24%), and Panamanian (64.3%, a difference of 0.31%).
| Demographics | Rating | Rank | College, Under 1 year |
| Spanish | 31.6 /100 | #189 | Fair 64.9% |
| Immigrants | Philippines | 30.1 /100 | #190 | Fair 64.8% |
| Immigrants | Armenia | 28.1 /100 | #191 | Fair 64.7% |
| Immigrants | Thailand | 27.0 /100 | #192 | Fair 64.7% |
| Slovaks | 26.7 /100 | #193 | Fair 64.7% |
| Immigrants | Cameroon | 24.6 /100 | #194 | Fair 64.6% |
| Immigrants | South Eastern Asia | 22.1 /100 | #195 | Fair 64.5% |
| Tongans | 21.2 /100 | #196 | Fair 64.5% |
| Costa Ricans | 19.6 /100 | #197 | Poor 64.4% |
| Tsimshian | 17.9 /100 | #198 | Poor 64.3% |
| Panamanians | 17.0 /100 | #199 | Poor 64.3% |
| Nigerians | 16.7 /100 | #200 | Poor 64.3% |
| French Canadians | 16.3 /100 | #201 | Poor 64.2% |
| South Americans | 16.2 /100 | #202 | Poor 64.2% |
| Uruguayans | 15.6 /100 | #203 | Poor 64.2% |