South African vs Immigrants from South Central Asia College, Under 1 year
COMPARE
South African
Immigrants from South Central Asia
College, Under 1 year
College, Under 1 year Comparison
South Africans
Immigrants from South Central Asia
69.7%
COLLEGE, UNDER 1 YEAR
99.7/ 100
METRIC RATING
53rd/ 347
METRIC RANK
72.1%
COLLEGE, UNDER 1 YEAR
100.0/ 100
METRIC RATING
11th/ 347
METRIC RANK
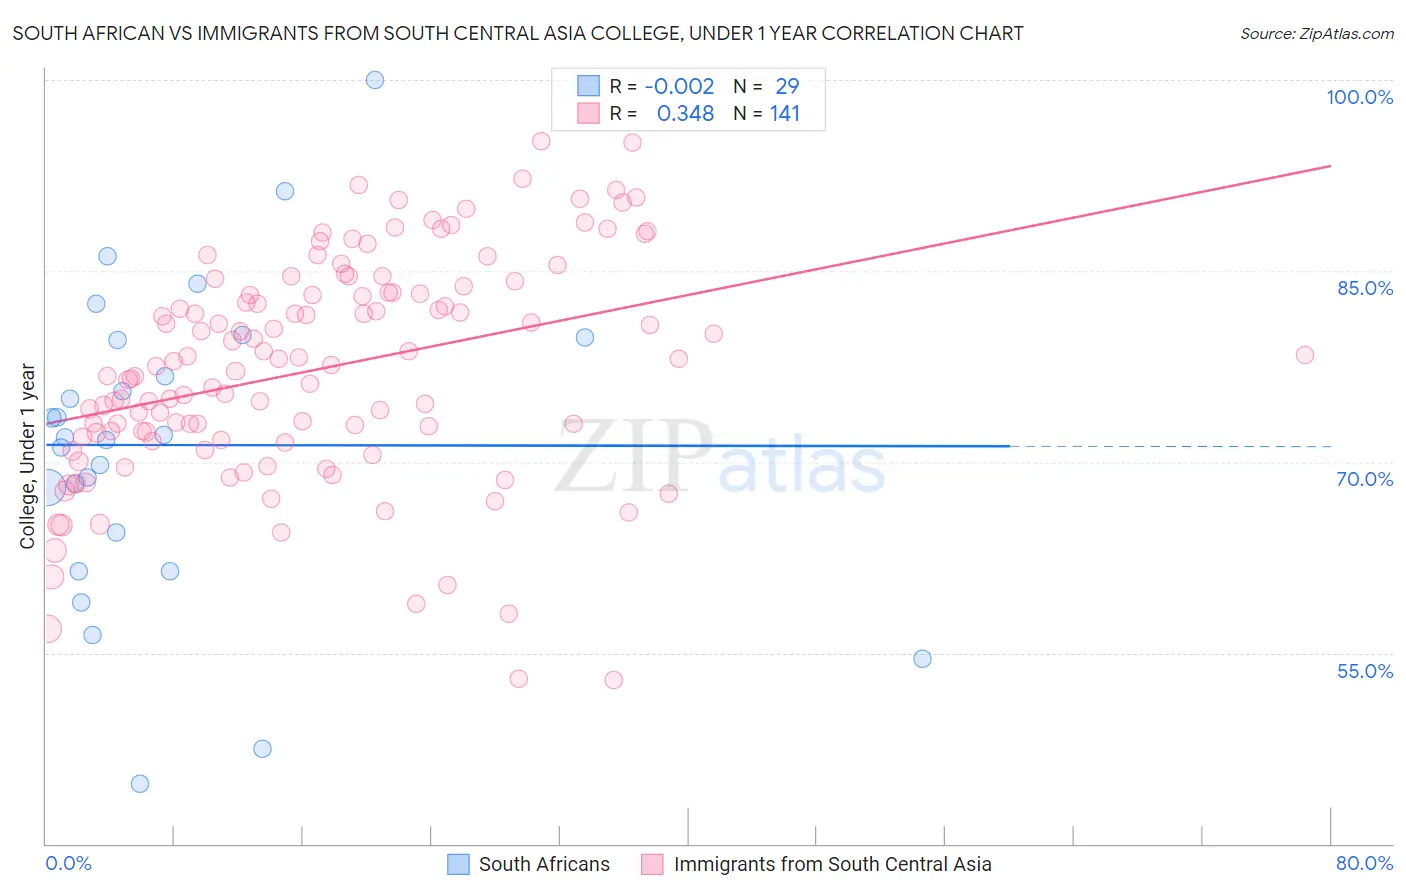
South African vs Immigrants from South Central Asia College, Under 1 year Correlation Chart
The statistical analysis conducted on geographies consisting of 182,603,987 people shows no correlation between the proportion of South Africans and percentage of population with at least college, under 1 year education in the United States with a correlation coefficient (R) of -0.002 and weighted average of 69.7%. Similarly, the statistical analysis conducted on geographies consisting of 473,110,045 people shows a mild positive correlation between the proportion of Immigrants from South Central Asia and percentage of population with at least college, under 1 year education in the United States with a correlation coefficient (R) of 0.348 and weighted average of 72.1%, a difference of 3.5%.
College, Under 1 year Correlation Summary
| Measurement | South African | Immigrants from South Central Asia |
| Minimum | 44.7% | 52.9% |
| Maximum | 100.0% | 95.2% |
| Range | 55.3% | 42.3% |
| Mean | 71.3% | 77.3% |
| Median | 71.9% | 77.6% |
| Interquartile 25% (IQ1) | 62.9% | 71.8% |
| Interquartile 75% (IQ3) | 79.7% | 83.3% |
| Interquartile Range (IQR) | 16.7% | 11.5% |
| Standard Deviation (Sample) | 12.3% | 8.7% |
| Standard Deviation (Population) | 12.1% | 8.7% |
Similar Demographics by College, Under 1 year
Demographics Similar to South Africans by College, Under 1 year
In terms of college, under 1 year, the demographic groups most similar to South Africans are Immigrants from Czechoslovakia (69.6%, a difference of 0.12%), Maltese (69.5%, a difference of 0.22%), Immigrants from Russia (69.9%, a difference of 0.27%), Mongolian (69.9%, a difference of 0.30%), and Zimbabwean (69.9%, a difference of 0.33%).
| Demographics | Rating | Rank | College, Under 1 year |
| Immigrants | Latvia | 99.9 /100 | #46 | Exceptional 70.1% |
| Immigrants | Bulgaria | 99.8 /100 | #47 | Exceptional 70.0% |
| Immigrants | Netherlands | 99.8 /100 | #48 | Exceptional 70.0% |
| Immigrants | Austria | 99.8 /100 | #49 | Exceptional 70.0% |
| Zimbabweans | 99.8 /100 | #50 | Exceptional 69.9% |
| Mongolians | 99.8 /100 | #51 | Exceptional 69.9% |
| Immigrants | Russia | 99.8 /100 | #52 | Exceptional 69.9% |
| South Africans | 99.7 /100 | #53 | Exceptional 69.7% |
| Immigrants | Czechoslovakia | 99.7 /100 | #54 | Exceptional 69.6% |
| Maltese | 99.7 /100 | #55 | Exceptional 69.5% |
| Immigrants | Scotland | 99.6 /100 | #56 | Exceptional 69.4% |
| Asians | 99.6 /100 | #57 | Exceptional 69.4% |
| Immigrants | Malaysia | 99.6 /100 | #58 | Exceptional 69.3% |
| Immigrants | Serbia | 99.5 /100 | #59 | Exceptional 69.3% |
| Immigrants | Asia | 99.5 /100 | #60 | Exceptional 69.2% |
Demographics Similar to Immigrants from South Central Asia by College, Under 1 year
In terms of college, under 1 year, the demographic groups most similar to Immigrants from South Central Asia are Immigrants from Sweden (72.1%, a difference of 0.0%), Cypriot (72.0%, a difference of 0.16%), Cambodian (71.9%, a difference of 0.28%), Burmese (71.9%, a difference of 0.28%), and Immigrants from Japan (71.9%, a difference of 0.29%).
| Demographics | Rating | Rank | College, Under 1 year |
| Immigrants | India | 100.0 /100 | #4 | Exceptional 74.4% |
| Immigrants | Iran | 100.0 /100 | #5 | Exceptional 74.3% |
| Immigrants | Taiwan | 100.0 /100 | #6 | Exceptional 74.2% |
| Okinawans | 100.0 /100 | #7 | Exceptional 73.7% |
| Thais | 100.0 /100 | #8 | Exceptional 73.4% |
| Immigrants | Australia | 100.0 /100 | #9 | Exceptional 72.7% |
| Immigrants | Israel | 100.0 /100 | #10 | Exceptional 72.3% |
| Immigrants | South Central Asia | 100.0 /100 | #11 | Exceptional 72.1% |
| Immigrants | Sweden | 100.0 /100 | #12 | Exceptional 72.1% |
| Cypriots | 100.0 /100 | #13 | Exceptional 72.0% |
| Cambodians | 100.0 /100 | #14 | Exceptional 71.9% |
| Burmese | 100.0 /100 | #15 | Exceptional 71.9% |
| Immigrants | Japan | 100.0 /100 | #16 | Exceptional 71.9% |
| Eastern Europeans | 100.0 /100 | #17 | Exceptional 71.8% |
| Immigrants | Switzerland | 100.0 /100 | #18 | Exceptional 71.7% |