South African vs Armenian College, Under 1 year
COMPARE
South African
Armenian
College, Under 1 year
College, Under 1 year Comparison
South Africans
Armenians
69.7%
COLLEGE, UNDER 1 YEAR
99.7/ 100
METRIC RATING
53rd/ 347
METRIC RANK
68.1%
COLLEGE, UNDER 1 YEAR
97.7/ 100
METRIC RATING
94th/ 347
METRIC RANK
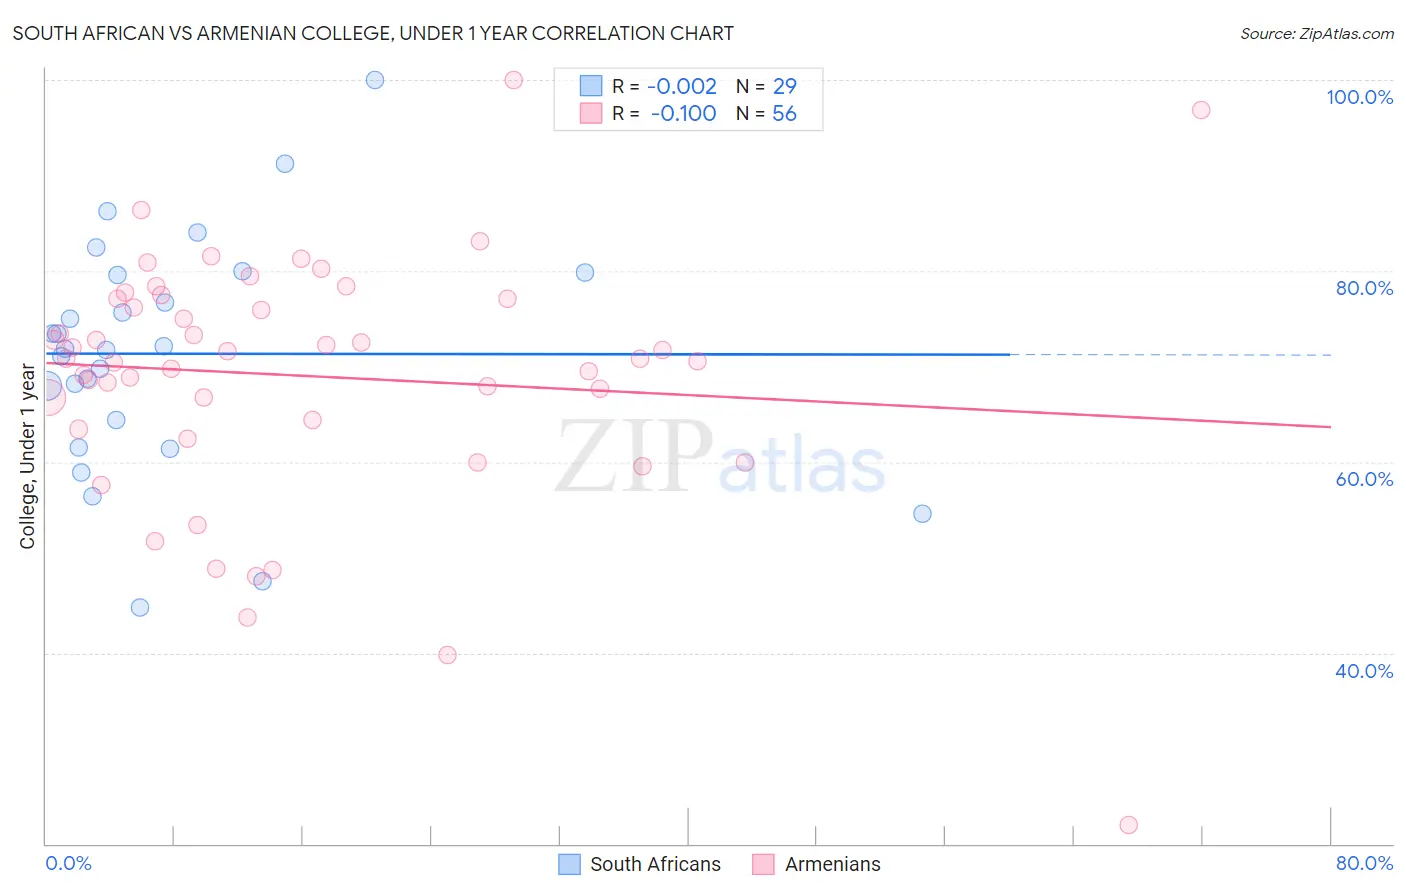
South African vs Armenian College, Under 1 year Correlation Chart
The statistical analysis conducted on geographies consisting of 182,603,987 people shows no correlation between the proportion of South Africans and percentage of population with at least college, under 1 year education in the United States with a correlation coefficient (R) of -0.002 and weighted average of 69.7%. Similarly, the statistical analysis conducted on geographies consisting of 310,952,332 people shows a poor negative correlation between the proportion of Armenians and percentage of population with at least college, under 1 year education in the United States with a correlation coefficient (R) of -0.100 and weighted average of 68.1%, a difference of 2.3%.
College, Under 1 year Correlation Summary
| Measurement | South African | Armenian |
| Minimum | 44.7% | 22.0% |
| Maximum | 100.0% | 100.0% |
| Range | 55.3% | 78.0% |
| Mean | 71.3% | 69.0% |
| Median | 71.9% | 70.8% |
| Interquartile 25% (IQ1) | 62.9% | 63.9% |
| Interquartile 75% (IQ3) | 79.7% | 77.1% |
| Interquartile Range (IQR) | 16.7% | 13.2% |
| Standard Deviation (Sample) | 12.3% | 13.2% |
| Standard Deviation (Population) | 12.1% | 13.1% |
Similar Demographics by College, Under 1 year
Demographics Similar to South Africans by College, Under 1 year
In terms of college, under 1 year, the demographic groups most similar to South Africans are Immigrants from Czechoslovakia (69.6%, a difference of 0.12%), Maltese (69.5%, a difference of 0.22%), Immigrants from Russia (69.9%, a difference of 0.27%), Mongolian (69.9%, a difference of 0.30%), and Zimbabwean (69.9%, a difference of 0.33%).
| Demographics | Rating | Rank | College, Under 1 year |
| Immigrants | Latvia | 99.9 /100 | #46 | Exceptional 70.1% |
| Immigrants | Bulgaria | 99.8 /100 | #47 | Exceptional 70.0% |
| Immigrants | Netherlands | 99.8 /100 | #48 | Exceptional 70.0% |
| Immigrants | Austria | 99.8 /100 | #49 | Exceptional 70.0% |
| Zimbabweans | 99.8 /100 | #50 | Exceptional 69.9% |
| Mongolians | 99.8 /100 | #51 | Exceptional 69.9% |
| Immigrants | Russia | 99.8 /100 | #52 | Exceptional 69.9% |
| South Africans | 99.7 /100 | #53 | Exceptional 69.7% |
| Immigrants | Czechoslovakia | 99.7 /100 | #54 | Exceptional 69.6% |
| Maltese | 99.7 /100 | #55 | Exceptional 69.5% |
| Immigrants | Scotland | 99.6 /100 | #56 | Exceptional 69.4% |
| Asians | 99.6 /100 | #57 | Exceptional 69.4% |
| Immigrants | Malaysia | 99.6 /100 | #58 | Exceptional 69.3% |
| Immigrants | Serbia | 99.5 /100 | #59 | Exceptional 69.3% |
| Immigrants | Asia | 99.5 /100 | #60 | Exceptional 69.2% |
Demographics Similar to Armenians by College, Under 1 year
In terms of college, under 1 year, the demographic groups most similar to Armenians are Romanian (68.2%, a difference of 0.090%), Immigrants from Pakistan (68.0%, a difference of 0.090%), Jordanian (68.0%, a difference of 0.13%), Immigrants from Ethiopia (68.0%, a difference of 0.15%), and Luxembourger (68.2%, a difference of 0.19%).
| Demographics | Rating | Rank | College, Under 1 year |
| Chinese | 98.3 /100 | #87 | Exceptional 68.3% |
| Croatians | 98.2 /100 | #88 | Exceptional 68.3% |
| Ethiopians | 98.2 /100 | #89 | Exceptional 68.3% |
| Icelanders | 98.1 /100 | #90 | Exceptional 68.3% |
| Europeans | 98.1 /100 | #91 | Exceptional 68.2% |
| Luxembourgers | 98.1 /100 | #92 | Exceptional 68.2% |
| Romanians | 97.9 /100 | #93 | Exceptional 68.2% |
| Armenians | 97.7 /100 | #94 | Exceptional 68.1% |
| Immigrants | Pakistan | 97.5 /100 | #95 | Exceptional 68.0% |
| Jordanians | 97.4 /100 | #96 | Exceptional 68.0% |
| Immigrants | Ethiopia | 97.3 /100 | #97 | Exceptional 68.0% |
| Paraguayans | 97.1 /100 | #98 | Exceptional 67.9% |
| Immigrants | Bolivia | 97.0 /100 | #99 | Exceptional 67.9% |
| Immigrants | Argentina | 97.0 /100 | #100 | Exceptional 67.9% |
| Immigrants | Eastern Europe | 96.9 /100 | #101 | Exceptional 67.9% |