South African vs Hungarian College, Under 1 year
COMPARE
South African
Hungarian
College, Under 1 year
College, Under 1 year Comparison
South Africans
Hungarians
69.7%
COLLEGE, UNDER 1 YEAR
99.7/ 100
METRIC RATING
53rd/ 347
METRIC RANK
65.6%
COLLEGE, UNDER 1 YEAR
55.9/ 100
METRIC RATING
168th/ 347
METRIC RANK
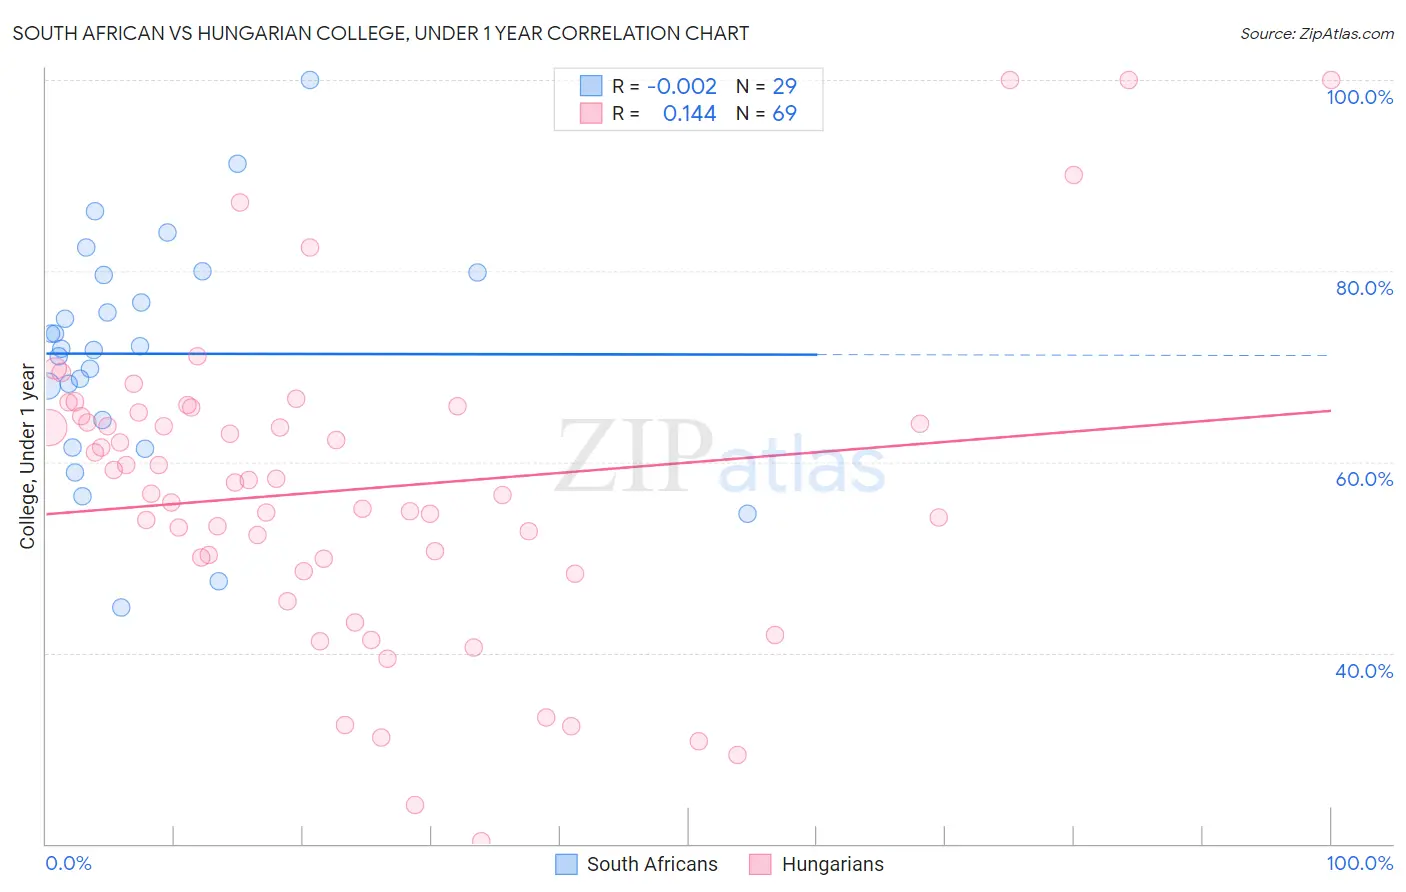
South African vs Hungarian College, Under 1 year Correlation Chart
The statistical analysis conducted on geographies consisting of 182,603,987 people shows no correlation between the proportion of South Africans and percentage of population with at least college, under 1 year education in the United States with a correlation coefficient (R) of -0.002 and weighted average of 69.7%. Similarly, the statistical analysis conducted on geographies consisting of 486,238,564 people shows a poor positive correlation between the proportion of Hungarians and percentage of population with at least college, under 1 year education in the United States with a correlation coefficient (R) of 0.144 and weighted average of 65.6%, a difference of 6.2%.
College, Under 1 year Correlation Summary
| Measurement | South African | Hungarian |
| Minimum | 44.7% | 20.2% |
| Maximum | 100.0% | 100.0% |
| Range | 55.3% | 79.8% |
| Mean | 71.3% | 57.1% |
| Median | 71.9% | 57.8% |
| Interquartile 25% (IQ1) | 62.9% | 49.2% |
| Interquartile 75% (IQ3) | 79.7% | 65.0% |
| Interquartile Range (IQR) | 16.7% | 15.8% |
| Standard Deviation (Sample) | 12.3% | 16.4% |
| Standard Deviation (Population) | 12.1% | 16.3% |
Similar Demographics by College, Under 1 year
Demographics Similar to South Africans by College, Under 1 year
In terms of college, under 1 year, the demographic groups most similar to South Africans are Immigrants from Czechoslovakia (69.6%, a difference of 0.12%), Maltese (69.5%, a difference of 0.22%), Immigrants from Russia (69.9%, a difference of 0.27%), Mongolian (69.9%, a difference of 0.30%), and Zimbabwean (69.9%, a difference of 0.33%).
| Demographics | Rating | Rank | College, Under 1 year |
| Immigrants | Latvia | 99.9 /100 | #46 | Exceptional 70.1% |
| Immigrants | Bulgaria | 99.8 /100 | #47 | Exceptional 70.0% |
| Immigrants | Netherlands | 99.8 /100 | #48 | Exceptional 70.0% |
| Immigrants | Austria | 99.8 /100 | #49 | Exceptional 70.0% |
| Zimbabweans | 99.8 /100 | #50 | Exceptional 69.9% |
| Mongolians | 99.8 /100 | #51 | Exceptional 69.9% |
| Immigrants | Russia | 99.8 /100 | #52 | Exceptional 69.9% |
| South Africans | 99.7 /100 | #53 | Exceptional 69.7% |
| Immigrants | Czechoslovakia | 99.7 /100 | #54 | Exceptional 69.6% |
| Maltese | 99.7 /100 | #55 | Exceptional 69.5% |
| Immigrants | Scotland | 99.6 /100 | #56 | Exceptional 69.4% |
| Asians | 99.6 /100 | #57 | Exceptional 69.4% |
| Immigrants | Malaysia | 99.6 /100 | #58 | Exceptional 69.3% |
| Immigrants | Serbia | 99.5 /100 | #59 | Exceptional 69.3% |
| Immigrants | Asia | 99.5 /100 | #60 | Exceptional 69.2% |
Demographics Similar to Hungarians by College, Under 1 year
In terms of college, under 1 year, the demographic groups most similar to Hungarians are Yugoslavian (65.6%, a difference of 0.010%), German (65.6%, a difference of 0.010%), Immigrants from Somalia (65.6%, a difference of 0.020%), Moroccan (65.6%, a difference of 0.030%), and Immigrants from Oceania (65.6%, a difference of 0.040%).
| Demographics | Rating | Rank | College, Under 1 year |
| Brazilians | 66.0 /100 | #161 | Good 65.9% |
| Koreans | 65.3 /100 | #162 | Good 65.9% |
| Somalis | 62.7 /100 | #163 | Good 65.8% |
| Czechoslovakians | 62.6 /100 | #164 | Good 65.8% |
| Immigrants | Uzbekistan | 61.6 /100 | #165 | Good 65.8% |
| Moroccans | 56.7 /100 | #166 | Average 65.6% |
| Immigrants | Somalia | 56.4 /100 | #167 | Average 65.6% |
| Hungarians | 55.9 /100 | #168 | Average 65.6% |
| Yugoslavians | 55.7 /100 | #169 | Average 65.6% |
| Germans | 55.7 /100 | #170 | Average 65.6% |
| Immigrants | Oceania | 55.0 /100 | #171 | Average 65.6% |
| South American Indians | 54.4 /100 | #172 | Average 65.5% |
| Swiss | 53.9 /100 | #173 | Average 65.5% |
| Immigrants | Bosnia and Herzegovina | 50.0 /100 | #174 | Average 65.4% |
| Scotch-Irish | 49.5 /100 | #175 | Average 65.4% |