South African vs Immigrants College, Under 1 year
COMPARE
South African
Immigrants
College, Under 1 year
College, Under 1 year Comparison
South Africans
Immigrants
69.7%
COLLEGE, UNDER 1 YEAR
99.7/ 100
METRIC RATING
53rd/ 347
METRIC RANK
62.5%
COLLEGE, UNDER 1 YEAR
1.7/ 100
METRIC RATING
236th/ 347
METRIC RANK
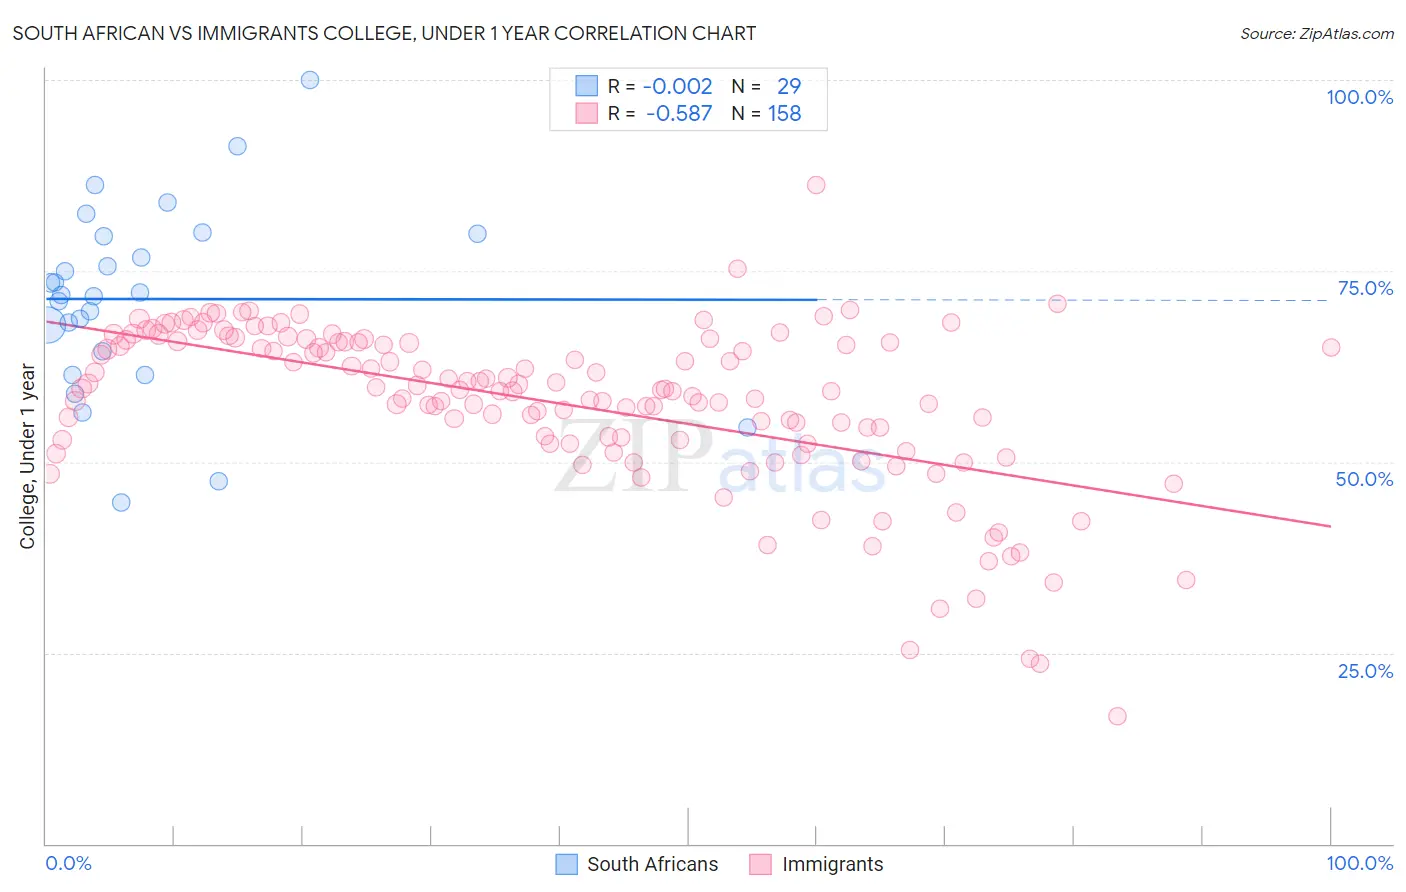
South African vs Immigrants College, Under 1 year Correlation Chart
The statistical analysis conducted on geographies consisting of 182,603,987 people shows no correlation between the proportion of South Africans and percentage of population with at least college, under 1 year education in the United States with a correlation coefficient (R) of -0.002 and weighted average of 69.7%. Similarly, the statistical analysis conducted on geographies consisting of 577,770,427 people shows a substantial negative correlation between the proportion of Immigrants and percentage of population with at least college, under 1 year education in the United States with a correlation coefficient (R) of -0.587 and weighted average of 62.5%, a difference of 11.5%.
College, Under 1 year Correlation Summary
| Measurement | South African | Immigrants |
| Minimum | 44.7% | 16.7% |
| Maximum | 100.0% | 86.3% |
| Range | 55.3% | 69.7% |
| Mean | 71.3% | 57.6% |
| Median | 71.9% | 59.4% |
| Interquartile 25% (IQ1) | 62.9% | 52.9% |
| Interquartile 75% (IQ3) | 79.7% | 65.7% |
| Interquartile Range (IQR) | 16.7% | 12.8% |
| Standard Deviation (Sample) | 12.3% | 10.9% |
| Standard Deviation (Population) | 12.1% | 10.8% |
Similar Demographics by College, Under 1 year
Demographics Similar to South Africans by College, Under 1 year
In terms of college, under 1 year, the demographic groups most similar to South Africans are Immigrants from Czechoslovakia (69.6%, a difference of 0.12%), Maltese (69.5%, a difference of 0.22%), Immigrants from Russia (69.9%, a difference of 0.27%), Mongolian (69.9%, a difference of 0.30%), and Zimbabwean (69.9%, a difference of 0.33%).
| Demographics | Rating | Rank | College, Under 1 year |
| Immigrants | Latvia | 99.9 /100 | #46 | Exceptional 70.1% |
| Immigrants | Bulgaria | 99.8 /100 | #47 | Exceptional 70.0% |
| Immigrants | Netherlands | 99.8 /100 | #48 | Exceptional 70.0% |
| Immigrants | Austria | 99.8 /100 | #49 | Exceptional 70.0% |
| Zimbabweans | 99.8 /100 | #50 | Exceptional 69.9% |
| Mongolians | 99.8 /100 | #51 | Exceptional 69.9% |
| Immigrants | Russia | 99.8 /100 | #52 | Exceptional 69.9% |
| South Africans | 99.7 /100 | #53 | Exceptional 69.7% |
| Immigrants | Czechoslovakia | 99.7 /100 | #54 | Exceptional 69.6% |
| Maltese | 99.7 /100 | #55 | Exceptional 69.5% |
| Immigrants | Scotland | 99.6 /100 | #56 | Exceptional 69.4% |
| Asians | 99.6 /100 | #57 | Exceptional 69.4% |
| Immigrants | Malaysia | 99.6 /100 | #58 | Exceptional 69.3% |
| Immigrants | Serbia | 99.5 /100 | #59 | Exceptional 69.3% |
| Immigrants | Asia | 99.5 /100 | #60 | Exceptional 69.2% |
Demographics Similar to Immigrants by College, Under 1 year
In terms of college, under 1 year, the demographic groups most similar to Immigrants are Immigrants from Burma/Myanmar (62.5%, a difference of 0.030%), French American Indian (62.4%, a difference of 0.12%), Spanish American (62.6%, a difference of 0.13%), Chippewa (62.6%, a difference of 0.18%), and Iroquois (62.6%, a difference of 0.21%).
| Demographics | Rating | Rank | College, Under 1 year |
| Liberians | 3.2 /100 | #229 | Tragic 63.0% |
| Immigrants | Nonimmigrants | 3.0 /100 | #230 | Tragic 62.9% |
| Immigrants | Western Africa | 2.4 /100 | #231 | Tragic 62.8% |
| Osage | 2.2 /100 | #232 | Tragic 62.7% |
| Iroquois | 2.0 /100 | #233 | Tragic 62.6% |
| Chippewa | 2.0 /100 | #234 | Tragic 62.6% |
| Spanish Americans | 1.9 /100 | #235 | Tragic 62.6% |
| Immigrants | Immigrants | 1.7 /100 | #236 | Tragic 62.5% |
| Immigrants | Burma/Myanmar | 1.6 /100 | #237 | Tragic 62.5% |
| French American Indians | 1.5 /100 | #238 | Tragic 62.4% |
| Nepalese | 1.1 /100 | #239 | Tragic 62.2% |
| Aleuts | 1.1 /100 | #240 | Tragic 62.2% |
| Ottawa | 1.1 /100 | #241 | Tragic 62.2% |
| Malaysians | 1.1 /100 | #242 | Tragic 62.2% |
| Hawaiians | 1.1 /100 | #243 | Tragic 62.1% |