Somali vs Immigrants from Eastern Asia GED/Equivalency
COMPARE
Somali
Immigrants from Eastern Asia
GED/Equivalency
GED/Equivalency Comparison
Somalis
Immigrants from Eastern Asia
85.0%
GED/EQUIVALENCY
16.4/ 100
METRIC RATING
199th/ 347
METRIC RANK
87.4%
GED/EQUIVALENCY
97.9/ 100
METRIC RATING
91st/ 347
METRIC RANK
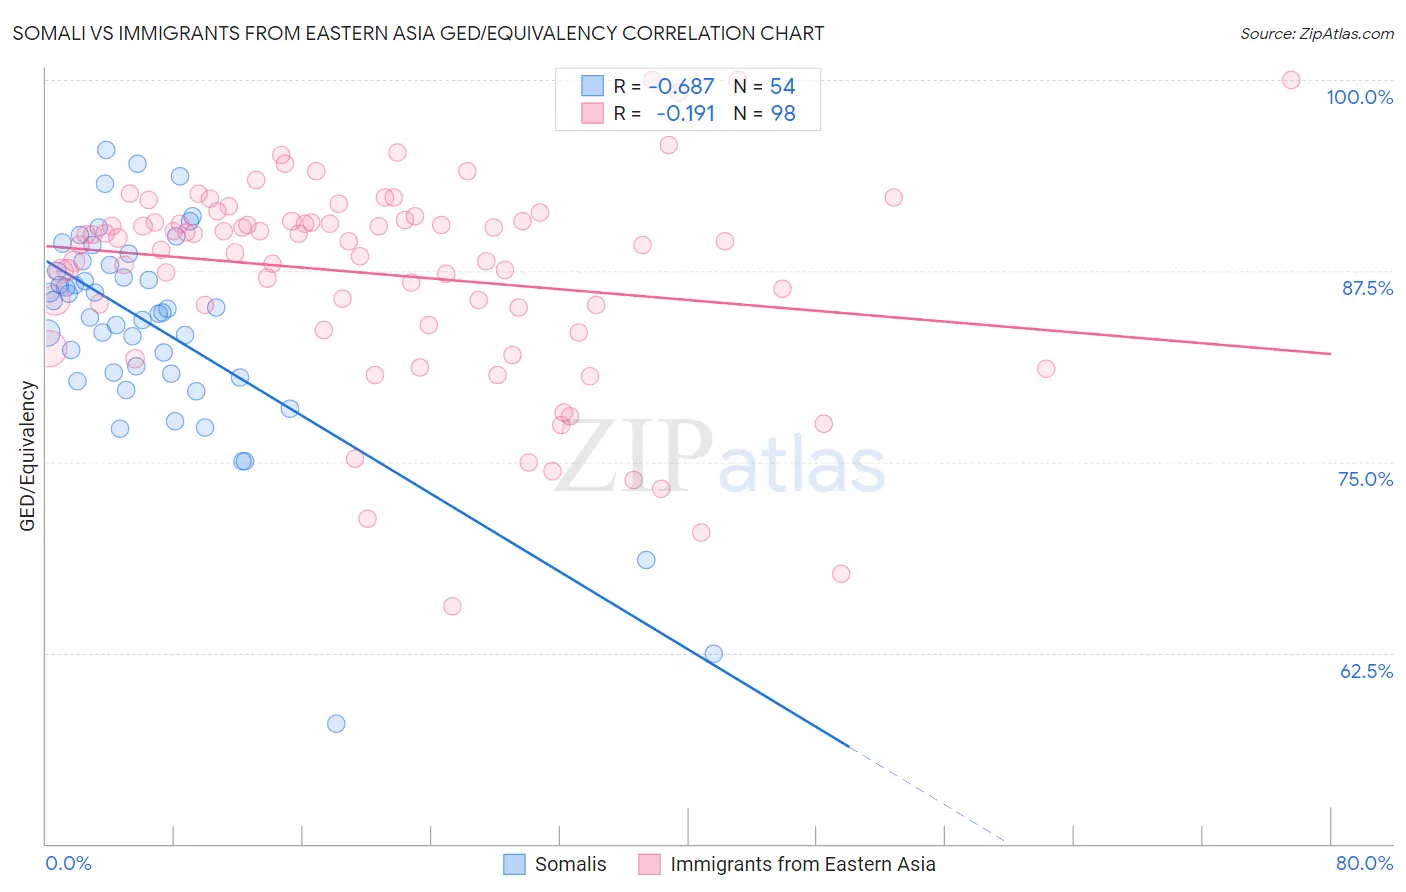
Somali vs Immigrants from Eastern Asia GED/Equivalency Correlation Chart
The statistical analysis conducted on geographies consisting of 99,332,457 people shows a significant negative correlation between the proportion of Somalis and percentage of population with at least ged/equivalency education in the United States with a correlation coefficient (R) of -0.687 and weighted average of 85.0%. Similarly, the statistical analysis conducted on geographies consisting of 499,846,164 people shows a poor negative correlation between the proportion of Immigrants from Eastern Asia and percentage of population with at least ged/equivalency education in the United States with a correlation coefficient (R) of -0.191 and weighted average of 87.4%, a difference of 2.8%.
GED/Equivalency Correlation Summary
| Measurement | Somali | Immigrants from Eastern Asia |
| Minimum | 57.9% | 65.6% |
| Maximum | 95.4% | 100.0% |
| Range | 37.5% | 34.4% |
| Mean | 83.8% | 87.3% |
| Median | 84.9% | 89.4% |
| Interquartile 25% (IQ1) | 80.8% | 85.1% |
| Interquartile 75% (IQ3) | 87.9% | 90.8% |
| Interquartile Range (IQR) | 7.1% | 5.6% |
| Standard Deviation (Sample) | 7.0% | 6.8% |
| Standard Deviation (Population) | 7.0% | 6.8% |
Similar Demographics by GED/Equivalency
Demographics Similar to Somalis by GED/Equivalency
In terms of ged/equivalency, the demographic groups most similar to Somalis are Uruguayan (85.0%, a difference of 0.010%), Portuguese (85.0%, a difference of 0.020%), Cree (85.0%, a difference of 0.020%), Immigrants from Africa (85.1%, a difference of 0.040%), and Panamanian (85.0%, a difference of 0.040%).
| Demographics | Rating | Rank | GED/Equivalency |
| Immigrants | Nonimmigrants | 22.7 /100 | #192 | Fair 85.2% |
| Delaware | 22.2 /100 | #193 | Fair 85.2% |
| Puget Sound Salish | 20.8 /100 | #194 | Fair 85.2% |
| Chippewa | 20.8 /100 | #195 | Fair 85.2% |
| Tongans | 20.7 /100 | #196 | Fair 85.2% |
| Costa Ricans | 20.4 /100 | #197 | Fair 85.2% |
| Immigrants | Africa | 17.5 /100 | #198 | Poor 85.1% |
| Somalis | 16.4 /100 | #199 | Poor 85.0% |
| Uruguayans | 16.0 /100 | #200 | Poor 85.0% |
| Portuguese | 15.9 /100 | #201 | Poor 85.0% |
| Cree | 15.9 /100 | #202 | Poor 85.0% |
| Panamanians | 15.3 /100 | #203 | Poor 85.0% |
| Hawaiians | 15.2 /100 | #204 | Poor 85.0% |
| Liberians | 14.6 /100 | #205 | Poor 85.0% |
| Samoans | 13.7 /100 | #206 | Poor 84.9% |
Demographics Similar to Immigrants from Eastern Asia by GED/Equivalency
In terms of ged/equivalency, the demographic groups most similar to Immigrants from Eastern Asia are Hungarian (87.4%, a difference of 0.010%), Welsh (87.4%, a difference of 0.010%), Israeli (87.4%, a difference of 0.010%), Immigrants from North Macedonia (87.4%, a difference of 0.020%), and Immigrants from Russia (87.4%, a difference of 0.020%).
| Demographics | Rating | Rank | GED/Equivalency |
| Immigrants | Romania | 98.1 /100 | #84 | Exceptional 87.5% |
| Dutch | 98.1 /100 | #85 | Exceptional 87.5% |
| Immigrants | Europe | 98.1 /100 | #86 | Exceptional 87.5% |
| Native Hawaiians | 98.1 /100 | #87 | Exceptional 87.5% |
| Immigrants | Norway | 98.1 /100 | #88 | Exceptional 87.5% |
| Hungarians | 97.9 /100 | #89 | Exceptional 87.4% |
| Welsh | 97.9 /100 | #90 | Exceptional 87.4% |
| Immigrants | Eastern Asia | 97.9 /100 | #91 | Exceptional 87.4% |
| Israelis | 97.8 /100 | #92 | Exceptional 87.4% |
| Immigrants | North Macedonia | 97.8 /100 | #93 | Exceptional 87.4% |
| Immigrants | Russia | 97.8 /100 | #94 | Exceptional 87.4% |
| Immigrants | Greece | 97.7 /100 | #95 | Exceptional 87.4% |
| Czechoslovakians | 97.6 /100 | #96 | Exceptional 87.4% |
| Immigrants | Western Europe | 97.3 /100 | #97 | Exceptional 87.3% |
| Immigrants | Croatia | 96.9 /100 | #98 | Exceptional 87.3% |