Chinese vs Senegalese College, 1 year or more
COMPARE
Chinese
Senegalese
College, 1 year or more
College, 1 year or more Comparison
Chinese
Senegalese
62.2%
COLLEGE, 1 YEAR OR MORE
97.2/ 100
METRIC RATING
96th/ 347
METRIC RANK
58.2%
COLLEGE, 1 YEAR OR MORE
16.9/ 100
METRIC RATING
207th/ 347
METRIC RANK
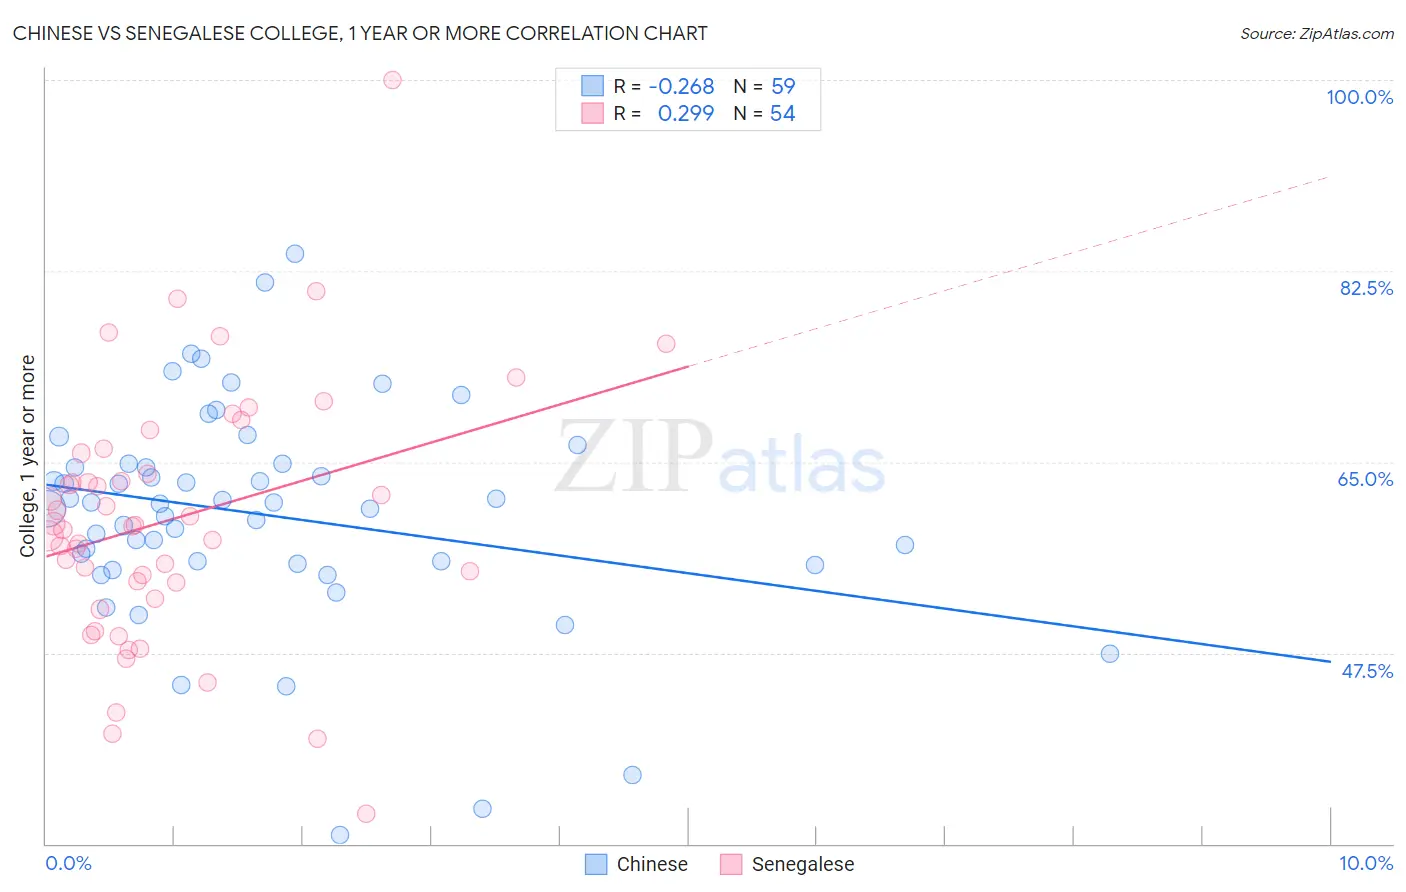
Chinese vs Senegalese College, 1 year or more Correlation Chart
The statistical analysis conducted on geographies consisting of 64,809,883 people shows a weak negative correlation between the proportion of Chinese and percentage of population with at least college, 1 year or more education in the United States with a correlation coefficient (R) of -0.268 and weighted average of 62.2%. Similarly, the statistical analysis conducted on geographies consisting of 78,142,569 people shows a weak positive correlation between the proportion of Senegalese and percentage of population with at least college, 1 year or more education in the United States with a correlation coefficient (R) of 0.299 and weighted average of 58.2%, a difference of 7.0%.
College, 1 year or more Correlation Summary
| Measurement | Chinese | Senegalese |
| Minimum | 30.8% | 32.7% |
| Maximum | 84.1% | 100.0% |
| Range | 53.3% | 67.3% |
| Mean | 60.1% | 59.8% |
| Median | 61.2% | 59.2% |
| Interquartile 25% (IQ1) | 55.6% | 54.0% |
| Interquartile 75% (IQ3) | 64.8% | 65.8% |
| Interquartile Range (IQR) | 9.1% | 11.8% |
| Standard Deviation (Sample) | 10.0% | 11.7% |
| Standard Deviation (Population) | 10.0% | 11.6% |
Similar Demographics by College, 1 year or more
Demographics Similar to Chinese by College, 1 year or more
In terms of college, 1 year or more, the demographic groups most similar to Chinese are Jordanian (62.2%, a difference of 0.010%), Carpatho Rusyn (62.2%, a difference of 0.010%), Croatian (62.2%, a difference of 0.010%), British (62.3%, a difference of 0.12%), and Icelander (62.1%, a difference of 0.17%).
| Demographics | Rating | Rank | College, 1 year or more |
| Immigrants | Ethiopia | 98.2 /100 | #89 | Exceptional 62.6% |
| Immigrants | Western Asia | 97.9 /100 | #90 | Exceptional 62.5% |
| Immigrants | Eastern Europe | 97.8 /100 | #91 | Exceptional 62.4% |
| Immigrants | Egypt | 97.8 /100 | #92 | Exceptional 62.4% |
| Romanians | 97.7 /100 | #93 | Exceptional 62.4% |
| Immigrants | Croatia | 97.6 /100 | #94 | Exceptional 62.3% |
| British | 97.4 /100 | #95 | Exceptional 62.3% |
| Chinese | 97.2 /100 | #96 | Exceptional 62.2% |
| Jordanians | 97.2 /100 | #97 | Exceptional 62.2% |
| Carpatho Rusyns | 97.2 /100 | #98 | Exceptional 62.2% |
| Croatians | 97.1 /100 | #99 | Exceptional 62.2% |
| Icelanders | 96.8 /100 | #100 | Exceptional 62.1% |
| Swedes | 96.8 /100 | #101 | Exceptional 62.1% |
| Luxembourgers | 96.7 /100 | #102 | Exceptional 62.1% |
| Afghans | 96.4 /100 | #103 | Exceptional 62.0% |
Demographics Similar to Senegalese by College, 1 year or more
In terms of college, 1 year or more, the demographic groups most similar to Senegalese are Immigrants from Vietnam (58.2%, a difference of 0.12%), Immigrants from Zaire (58.3%, a difference of 0.16%), Immigrants from Uruguay (58.1%, a difference of 0.17%), Panamanian (58.3%, a difference of 0.21%), and Immigrants from Middle Africa (58.0%, a difference of 0.30%).
| Demographics | Rating | Rank | College, 1 year or more |
| Spanish | 24.2 /100 | #200 | Fair 58.5% |
| Nigerians | 23.0 /100 | #201 | Fair 58.5% |
| Immigrants | South America | 21.9 /100 | #202 | Fair 58.4% |
| Ghanaians | 20.9 /100 | #203 | Fair 58.4% |
| Panamanians | 19.2 /100 | #204 | Poor 58.3% |
| Immigrants | Zaire | 18.7 /100 | #205 | Poor 58.3% |
| Immigrants | Vietnam | 18.2 /100 | #206 | Poor 58.2% |
| Senegalese | 16.9 /100 | #207 | Poor 58.2% |
| Immigrants | Uruguay | 15.2 /100 | #208 | Poor 58.1% |
| Immigrants | Middle Africa | 14.0 /100 | #209 | Poor 58.0% |
| Tsimshian | 13.5 /100 | #210 | Poor 57.9% |
| Immigrants | Nigeria | 13.3 /100 | #211 | Poor 57.9% |
| Immigrants | Senegal | 11.8 /100 | #212 | Poor 57.8% |
| French Canadians | 11.8 /100 | #213 | Poor 57.8% |
| Immigrants | Colombia | 11.6 /100 | #214 | Poor 57.8% |