Immigrants from Oceania vs Senegalese College, 1 year or more
COMPARE
Immigrants from Oceania
Senegalese
College, 1 year or more
College, 1 year or more Comparison
Immigrants from Oceania
Senegalese
59.4%
COLLEGE, 1 YEAR OR MORE
51.2/ 100
METRIC RATING
173rd/ 347
METRIC RANK
58.2%
COLLEGE, 1 YEAR OR MORE
16.9/ 100
METRIC RATING
207th/ 347
METRIC RANK
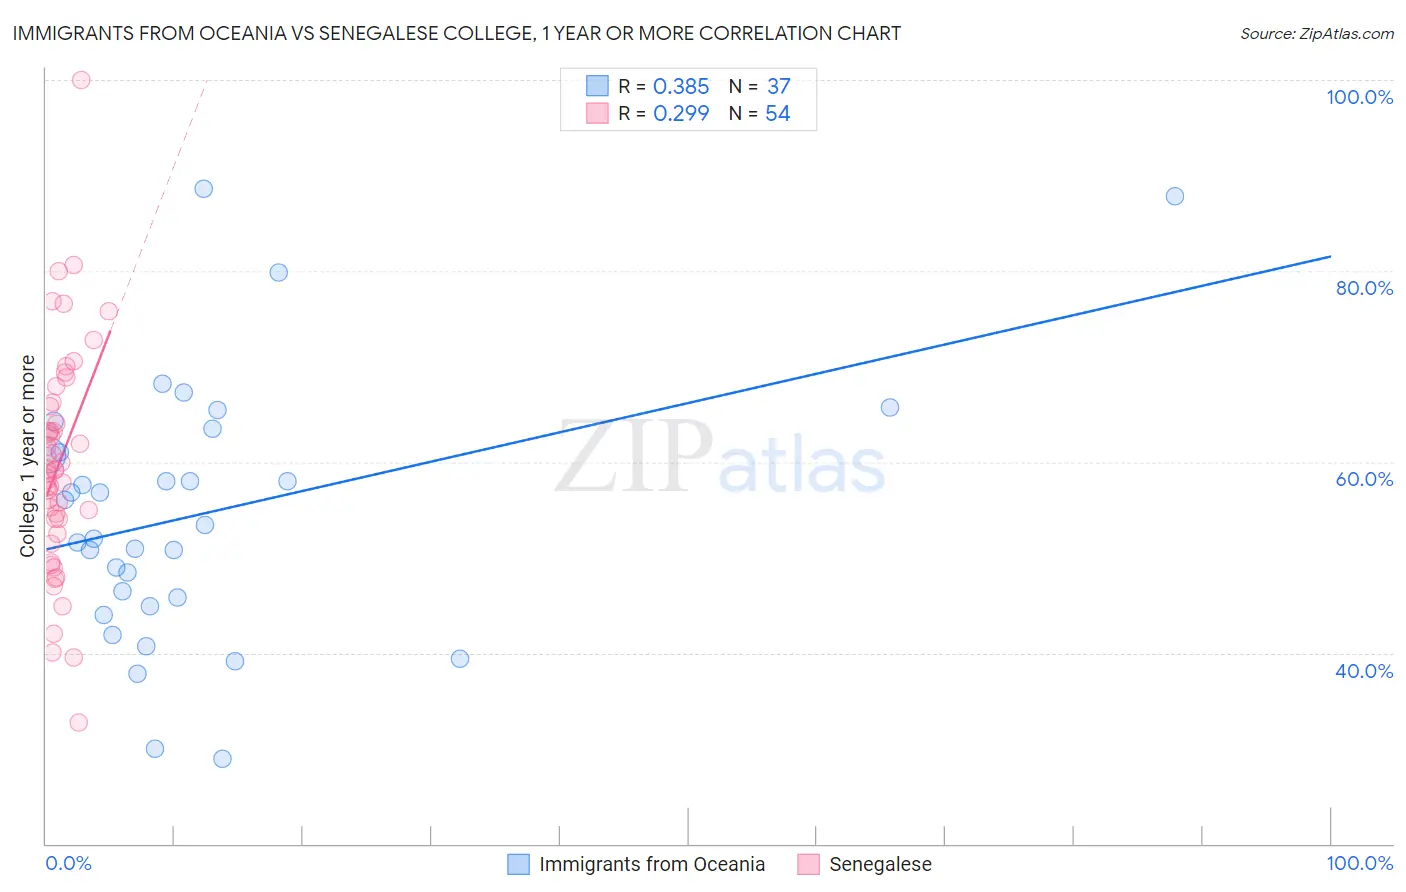
Immigrants from Oceania vs Senegalese College, 1 year or more Correlation Chart
The statistical analysis conducted on geographies consisting of 305,519,500 people shows a mild positive correlation between the proportion of Immigrants from Oceania and percentage of population with at least college, 1 year or more education in the United States with a correlation coefficient (R) of 0.385 and weighted average of 59.4%. Similarly, the statistical analysis conducted on geographies consisting of 78,142,569 people shows a weak positive correlation between the proportion of Senegalese and percentage of population with at least college, 1 year or more education in the United States with a correlation coefficient (R) of 0.299 and weighted average of 58.2%, a difference of 2.2%.
College, 1 year or more Correlation Summary
| Measurement | Immigrants from Oceania | Senegalese |
| Minimum | 28.9% | 32.7% |
| Maximum | 88.6% | 100.0% |
| Range | 59.6% | 67.3% |
| Mean | 54.6% | 59.8% |
| Median | 53.4% | 59.2% |
| Interquartile 25% (IQ1) | 45.3% | 54.0% |
| Interquartile 75% (IQ3) | 62.3% | 65.8% |
| Interquartile Range (IQR) | 16.9% | 11.8% |
| Standard Deviation (Sample) | 13.6% | 11.7% |
| Standard Deviation (Population) | 13.4% | 11.6% |
Similar Demographics by College, 1 year or more
Demographics Similar to Immigrants from Oceania by College, 1 year or more
In terms of college, 1 year or more, the demographic groups most similar to Immigrants from Oceania are Immigrants from Sierra Leone (59.5%, a difference of 0.050%), Welsh (59.5%, a difference of 0.060%), Immigrants from Albania (59.5%, a difference of 0.060%), Celtic (59.4%, a difference of 0.060%), and Immigrants from Southern Europe (59.5%, a difference of 0.080%).
| Demographics | Rating | Rank | College, 1 year or more |
| Immigrants | Africa | 56.1 /100 | #166 | Average 59.6% |
| Immigrants | North Macedonia | 53.1 /100 | #167 | Average 59.5% |
| Hungarians | 52.9 /100 | #168 | Average 59.5% |
| Immigrants | Southern Europe | 52.7 /100 | #169 | Average 59.5% |
| Welsh | 52.4 /100 | #170 | Average 59.5% |
| Immigrants | Albania | 52.3 /100 | #171 | Average 59.5% |
| Immigrants | Sierra Leone | 52.2 /100 | #172 | Average 59.5% |
| Immigrants | Oceania | 51.2 /100 | #173 | Average 59.4% |
| Celtics | 50.0 /100 | #174 | Average 59.4% |
| Sri Lankans | 49.0 /100 | #175 | Average 59.4% |
| Immigrants | Poland | 48.9 /100 | #176 | Average 59.4% |
| Tlingit-Haida | 48.4 /100 | #177 | Average 59.4% |
| Czechoslovakians | 48.3 /100 | #178 | Average 59.4% |
| Bermudans | 46.6 /100 | #179 | Average 59.3% |
| Yugoslavians | 44.1 /100 | #180 | Average 59.2% |
Demographics Similar to Senegalese by College, 1 year or more
In terms of college, 1 year or more, the demographic groups most similar to Senegalese are Immigrants from Vietnam (58.2%, a difference of 0.12%), Immigrants from Zaire (58.3%, a difference of 0.16%), Immigrants from Uruguay (58.1%, a difference of 0.17%), Panamanian (58.3%, a difference of 0.21%), and Immigrants from Middle Africa (58.0%, a difference of 0.30%).
| Demographics | Rating | Rank | College, 1 year or more |
| Spanish | 24.2 /100 | #200 | Fair 58.5% |
| Nigerians | 23.0 /100 | #201 | Fair 58.5% |
| Immigrants | South America | 21.9 /100 | #202 | Fair 58.4% |
| Ghanaians | 20.9 /100 | #203 | Fair 58.4% |
| Panamanians | 19.2 /100 | #204 | Poor 58.3% |
| Immigrants | Zaire | 18.7 /100 | #205 | Poor 58.3% |
| Immigrants | Vietnam | 18.2 /100 | #206 | Poor 58.2% |
| Senegalese | 16.9 /100 | #207 | Poor 58.2% |
| Immigrants | Uruguay | 15.2 /100 | #208 | Poor 58.1% |
| Immigrants | Middle Africa | 14.0 /100 | #209 | Poor 58.0% |
| Tsimshian | 13.5 /100 | #210 | Poor 57.9% |
| Immigrants | Nigeria | 13.3 /100 | #211 | Poor 57.9% |
| Immigrants | Senegal | 11.8 /100 | #212 | Poor 57.8% |
| French Canadians | 11.8 /100 | #213 | Poor 57.8% |
| Immigrants | Colombia | 11.6 /100 | #214 | Poor 57.8% |