Immigrants from Fiji vs Senegalese College, 1 year or more
COMPARE
Immigrants from Fiji
Senegalese
College, 1 year or more
College, 1 year or more Comparison
Immigrants from Fiji
Senegalese
56.9%
COLLEGE, 1 YEAR OR MORE
4.0/ 100
METRIC RATING
228th/ 347
METRIC RANK
58.2%
COLLEGE, 1 YEAR OR MORE
16.9/ 100
METRIC RATING
207th/ 347
METRIC RANK
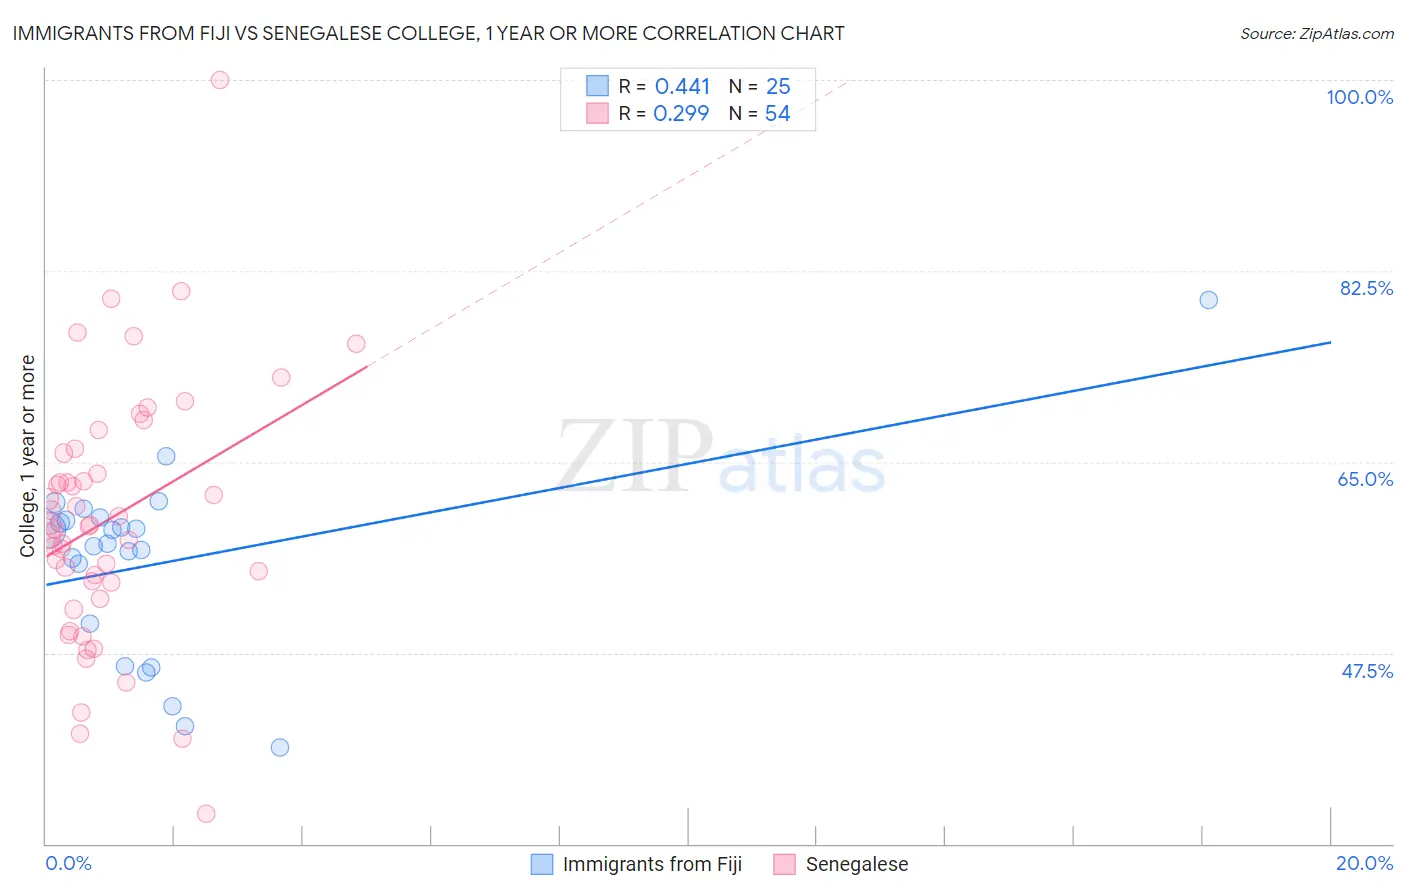
Immigrants from Fiji vs Senegalese College, 1 year or more Correlation Chart
The statistical analysis conducted on geographies consisting of 93,755,737 people shows a moderate positive correlation between the proportion of Immigrants from Fiji and percentage of population with at least college, 1 year or more education in the United States with a correlation coefficient (R) of 0.441 and weighted average of 56.9%. Similarly, the statistical analysis conducted on geographies consisting of 78,142,569 people shows a weak positive correlation between the proportion of Senegalese and percentage of population with at least college, 1 year or more education in the United States with a correlation coefficient (R) of 0.299 and weighted average of 58.2%, a difference of 2.2%.
College, 1 year or more Correlation Summary
| Measurement | Immigrants from Fiji | Senegalese |
| Minimum | 38.9% | 32.7% |
| Maximum | 79.8% | 100.0% |
| Range | 40.9% | 67.3% |
| Mean | 55.8% | 59.8% |
| Median | 57.5% | 59.2% |
| Interquartile 25% (IQ1) | 48.2% | 54.0% |
| Interquartile 75% (IQ3) | 59.8% | 65.8% |
| Interquartile Range (IQR) | 11.5% | 11.8% |
| Standard Deviation (Sample) | 8.8% | 11.7% |
| Standard Deviation (Population) | 8.6% | 11.6% |
Similar Demographics by College, 1 year or more
Demographics Similar to Immigrants from Fiji by College, 1 year or more
In terms of college, 1 year or more, the demographic groups most similar to Immigrants from Fiji are Cree (56.8%, a difference of 0.13%), Immigrants (57.0%, a difference of 0.15%), Immigrants from Western Africa (57.0%, a difference of 0.21%), Vietnamese (57.0%, a difference of 0.24%), and Liberian (56.7%, a difference of 0.35%).
| Demographics | Rating | Rank | College, 1 year or more |
| Immigrants | Ghana | 7.7 /100 | #221 | Tragic 57.4% |
| Sub-Saharan Africans | 6.1 /100 | #222 | Tragic 57.3% |
| Portuguese | 5.4 /100 | #223 | Tragic 57.2% |
| Hmong | 5.4 /100 | #224 | Tragic 57.2% |
| Vietnamese | 4.7 /100 | #225 | Tragic 57.0% |
| Immigrants | Western Africa | 4.6 /100 | #226 | Tragic 57.0% |
| Immigrants | Immigrants | 4.4 /100 | #227 | Tragic 57.0% |
| Immigrants | Fiji | 4.0 /100 | #228 | Tragic 56.9% |
| Cree | 3.6 /100 | #229 | Tragic 56.8% |
| Liberians | 3.1 /100 | #230 | Tragic 56.7% |
| Immigrants | Burma/Myanmar | 2.7 /100 | #231 | Tragic 56.6% |
| Immigrants | Bangladesh | 2.6 /100 | #232 | Tragic 56.6% |
| Immigrants | Nonimmigrants | 2.5 /100 | #233 | Tragic 56.5% |
| Spanish Americans | 1.8 /100 | #234 | Tragic 56.3% |
| West Indians | 1.8 /100 | #235 | Tragic 56.3% |
Demographics Similar to Senegalese by College, 1 year or more
In terms of college, 1 year or more, the demographic groups most similar to Senegalese are Immigrants from Vietnam (58.2%, a difference of 0.12%), Immigrants from Zaire (58.3%, a difference of 0.16%), Immigrants from Uruguay (58.1%, a difference of 0.17%), Panamanian (58.3%, a difference of 0.21%), and Immigrants from Middle Africa (58.0%, a difference of 0.30%).
| Demographics | Rating | Rank | College, 1 year or more |
| Spanish | 24.2 /100 | #200 | Fair 58.5% |
| Nigerians | 23.0 /100 | #201 | Fair 58.5% |
| Immigrants | South America | 21.9 /100 | #202 | Fair 58.4% |
| Ghanaians | 20.9 /100 | #203 | Fair 58.4% |
| Panamanians | 19.2 /100 | #204 | Poor 58.3% |
| Immigrants | Zaire | 18.7 /100 | #205 | Poor 58.3% |
| Immigrants | Vietnam | 18.2 /100 | #206 | Poor 58.2% |
| Senegalese | 16.9 /100 | #207 | Poor 58.2% |
| Immigrants | Uruguay | 15.2 /100 | #208 | Poor 58.1% |
| Immigrants | Middle Africa | 14.0 /100 | #209 | Poor 58.0% |
| Tsimshian | 13.5 /100 | #210 | Poor 57.9% |
| Immigrants | Nigeria | 13.3 /100 | #211 | Poor 57.9% |
| Immigrants | Senegal | 11.8 /100 | #212 | Poor 57.8% |
| French Canadians | 11.8 /100 | #213 | Poor 57.8% |
| Immigrants | Colombia | 11.6 /100 | #214 | Poor 57.8% |