Lebanese vs Indian (Asian) College, 1 year or more
COMPARE
Lebanese
Indian (Asian)
College, 1 year or more
College, 1 year or more Comparison
Lebanese
Indians (Asian)
61.6%
COLLEGE, 1 YEAR OR MORE
94.1/ 100
METRIC RATING
116th/ 347
METRIC RANK
66.1%
COLLEGE, 1 YEAR OR MORE
100.0/ 100
METRIC RATING
25th/ 347
METRIC RANK
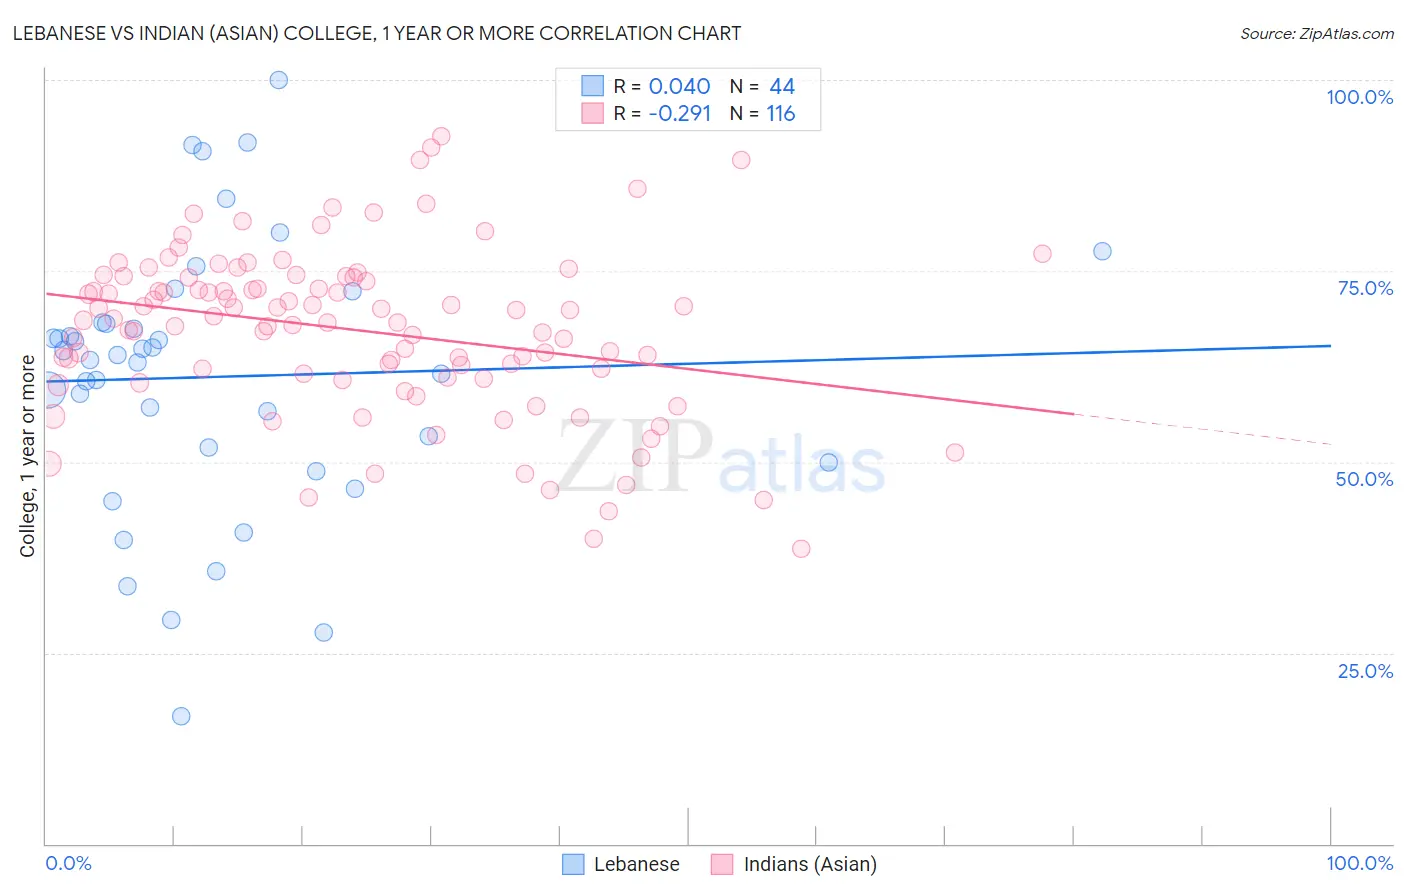
Lebanese vs Indian (Asian) College, 1 year or more Correlation Chart
The statistical analysis conducted on geographies consisting of 401,622,274 people shows no correlation between the proportion of Lebanese and percentage of population with at least college, 1 year or more education in the United States with a correlation coefficient (R) of 0.040 and weighted average of 61.6%. Similarly, the statistical analysis conducted on geographies consisting of 495,342,032 people shows a weak negative correlation between the proportion of Indians (Asian) and percentage of population with at least college, 1 year or more education in the United States with a correlation coefficient (R) of -0.291 and weighted average of 66.1%, a difference of 7.3%.
College, 1 year or more Correlation Summary
| Measurement | Lebanese | Indian (Asian) |
| Minimum | 16.6% | 38.6% |
| Maximum | 100.0% | 92.7% |
| Range | 83.4% | 54.1% |
| Mean | 61.1% | 67.3% |
| Median | 63.7% | 68.7% |
| Interquartile 25% (IQ1) | 50.9% | 61.3% |
| Interquartile 75% (IQ3) | 68.2% | 74.1% |
| Interquartile Range (IQR) | 17.3% | 12.8% |
| Standard Deviation (Sample) | 17.8% | 10.8% |
| Standard Deviation (Population) | 17.6% | 10.8% |
Similar Demographics by College, 1 year or more
Demographics Similar to Lebanese by College, 1 year or more
In terms of college, 1 year or more, the demographic groups most similar to Lebanese are Arab (61.6%, a difference of 0.040%), Immigrants from Brazil (61.6%, a difference of 0.050%), Norwegian (61.7%, a difference of 0.10%), Danish (61.7%, a difference of 0.17%), and Assyrian/Chaldean/Syriac (61.5%, a difference of 0.18%).
| Demographics | Rating | Rank | College, 1 year or more |
| Immigrants | Northern Africa | 95.7 /100 | #109 | Exceptional 61.9% |
| Europeans | 95.6 /100 | #110 | Exceptional 61.8% |
| Macedonians | 95.6 /100 | #111 | Exceptional 61.8% |
| Austrians | 95.4 /100 | #112 | Exceptional 61.8% |
| Ukrainians | 95.2 /100 | #113 | Exceptional 61.8% |
| Danes | 94.8 /100 | #114 | Exceptional 61.7% |
| Norwegians | 94.5 /100 | #115 | Exceptional 61.7% |
| Lebanese | 94.1 /100 | #116 | Exceptional 61.6% |
| Arabs | 93.9 /100 | #117 | Exceptional 61.6% |
| Immigrants | Brazil | 93.9 /100 | #118 | Exceptional 61.6% |
| Assyrians/Chaldeans/Syriacs | 93.3 /100 | #119 | Exceptional 61.5% |
| Pakistanis | 93.2 /100 | #120 | Exceptional 61.5% |
| Immigrants | Jordan | 92.7 /100 | #121 | Exceptional 61.4% |
| Immigrants | Chile | 92.3 /100 | #122 | Exceptional 61.4% |
| Serbians | 92.2 /100 | #123 | Exceptional 61.4% |
Demographics Similar to Indians (Asian) by College, 1 year or more
In terms of college, 1 year or more, the demographic groups most similar to Indians (Asian) are Latvian (66.1%, a difference of 0.040%), Immigrants from Ireland (65.9%, a difference of 0.24%), Immigrants from Belgium (66.3%, a difference of 0.35%), Immigrants from France (65.8%, a difference of 0.41%), and Immigrants from China (66.4%, a difference of 0.43%).
| Demographics | Rating | Rank | College, 1 year or more |
| Eastern Europeans | 100.0 /100 | #18 | Exceptional 66.6% |
| Immigrants | Switzerland | 100.0 /100 | #19 | Exceptional 66.5% |
| Immigrants | Korea | 100.0 /100 | #20 | Exceptional 66.5% |
| Immigrants | Hong Kong | 100.0 /100 | #21 | Exceptional 66.4% |
| Soviet Union | 100.0 /100 | #22 | Exceptional 66.4% |
| Immigrants | China | 100.0 /100 | #23 | Exceptional 66.4% |
| Immigrants | Belgium | 100.0 /100 | #24 | Exceptional 66.3% |
| Indians (Asian) | 100.0 /100 | #25 | Exceptional 66.1% |
| Latvians | 100.0 /100 | #26 | Exceptional 66.1% |
| Immigrants | Ireland | 100.0 /100 | #27 | Exceptional 65.9% |
| Immigrants | France | 100.0 /100 | #28 | Exceptional 65.8% |
| Immigrants | Northern Europe | 100.0 /100 | #29 | Exceptional 65.6% |
| Immigrants | Denmark | 100.0 /100 | #30 | Exceptional 65.6% |
| Turks | 100.0 /100 | #31 | Exceptional 65.5% |
| Bulgarians | 100.0 /100 | #32 | Exceptional 65.5% |