Immigrants from Micronesia vs Indian (Asian) College, 1 year or more
COMPARE
Immigrants from Micronesia
Indian (Asian)
College, 1 year or more
College, 1 year or more Comparison
Immigrants from Micronesia
Indians (Asian)
54.8%
COLLEGE, 1 YEAR OR MORE
0.3/ 100
METRIC RATING
264th/ 347
METRIC RANK
66.1%
COLLEGE, 1 YEAR OR MORE
100.0/ 100
METRIC RATING
25th/ 347
METRIC RANK
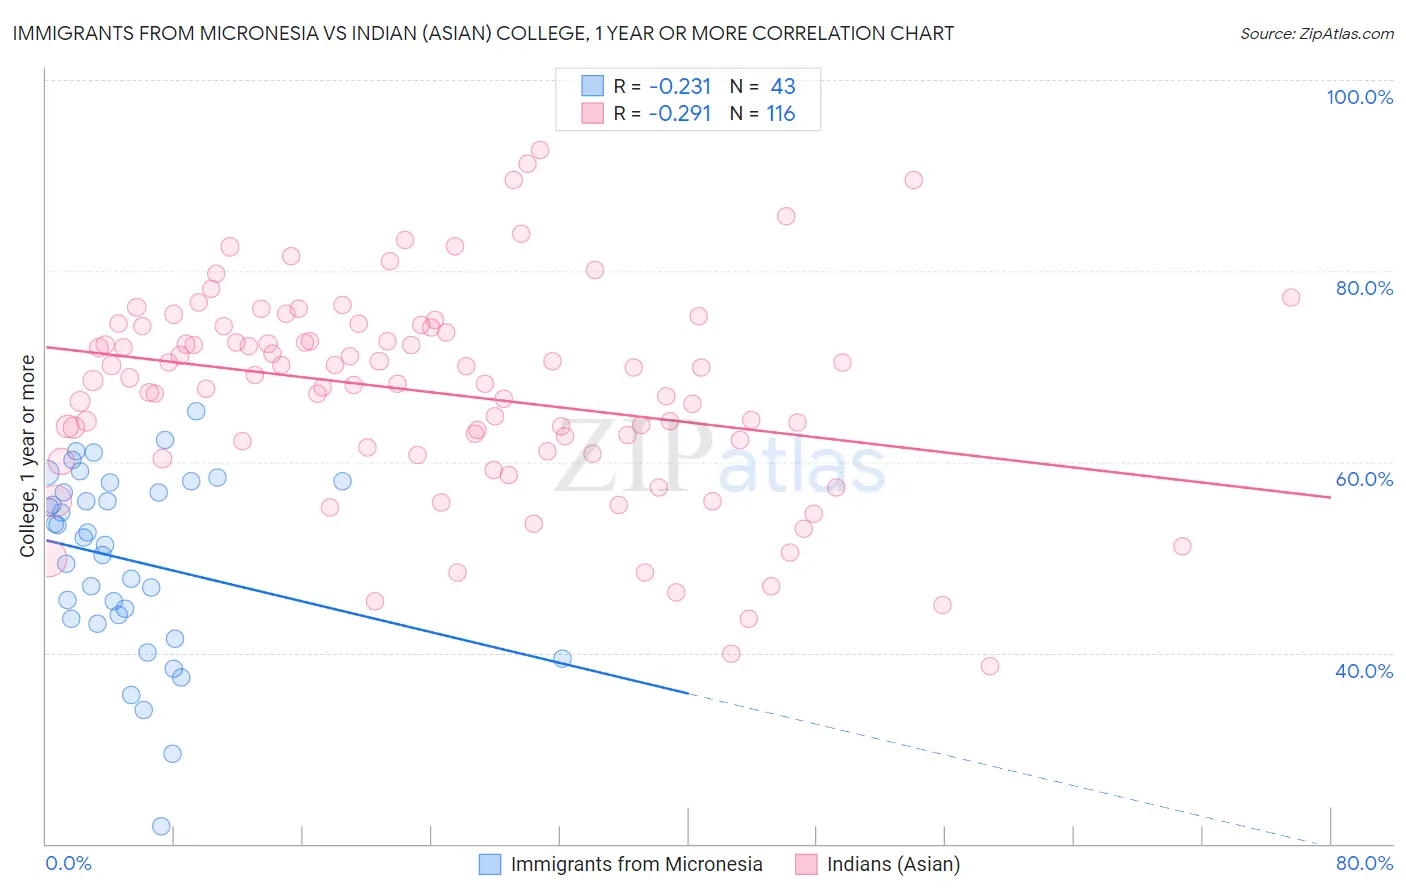
Immigrants from Micronesia vs Indian (Asian) College, 1 year or more Correlation Chart
The statistical analysis conducted on geographies consisting of 61,608,832 people shows a weak negative correlation between the proportion of Immigrants from Micronesia and percentage of population with at least college, 1 year or more education in the United States with a correlation coefficient (R) of -0.231 and weighted average of 54.8%. Similarly, the statistical analysis conducted on geographies consisting of 495,342,032 people shows a weak negative correlation between the proportion of Indians (Asian) and percentage of population with at least college, 1 year or more education in the United States with a correlation coefficient (R) of -0.291 and weighted average of 66.1%, a difference of 20.6%.
College, 1 year or more Correlation Summary
| Measurement | Immigrants from Micronesia | Indian (Asian) |
| Minimum | 21.8% | 38.6% |
| Maximum | 65.3% | 92.7% |
| Range | 43.6% | 54.1% |
| Mean | 49.7% | 67.3% |
| Median | 52.0% | 68.7% |
| Interquartile 25% (IQ1) | 43.6% | 61.3% |
| Interquartile 75% (IQ3) | 57.9% | 74.1% |
| Interquartile Range (IQR) | 14.3% | 12.8% |
| Standard Deviation (Sample) | 9.7% | 10.8% |
| Standard Deviation (Population) | 9.5% | 10.8% |
Similar Demographics by College, 1 year or more
Demographics Similar to Immigrants from Micronesia by College, 1 year or more
In terms of college, 1 year or more, the demographic groups most similar to Immigrants from Micronesia are U.S. Virgin Islander (54.8%, a difference of 0.020%), Immigrants from St. Vincent and the Grenadines (54.8%, a difference of 0.050%), Ottawa (54.9%, a difference of 0.13%), Jamaican (54.9%, a difference of 0.16%), and Immigrants from Laos (54.7%, a difference of 0.19%).
| Demographics | Rating | Rank | College, 1 year or more |
| Indonesians | 0.4 /100 | #257 | Tragic 55.1% |
| Africans | 0.4 /100 | #258 | Tragic 55.0% |
| Nepalese | 0.3 /100 | #259 | Tragic 54.9% |
| Jamaicans | 0.3 /100 | #260 | Tragic 54.9% |
| Ottawa | 0.3 /100 | #261 | Tragic 54.9% |
| Immigrants | St. Vincent and the Grenadines | 0.3 /100 | #262 | Tragic 54.8% |
| U.S. Virgin Islanders | 0.3 /100 | #263 | Tragic 54.8% |
| Immigrants | Micronesia | 0.3 /100 | #264 | Tragic 54.8% |
| Immigrants | Laos | 0.2 /100 | #265 | Tragic 54.7% |
| Potawatomi | 0.2 /100 | #266 | Tragic 54.6% |
| Blackfeet | 0.2 /100 | #267 | Tragic 54.6% |
| British West Indians | 0.2 /100 | #268 | Tragic 54.5% |
| Bangladeshis | 0.2 /100 | #269 | Tragic 54.5% |
| Crow | 0.2 /100 | #270 | Tragic 54.5% |
| Bahamians | 0.2 /100 | #271 | Tragic 54.5% |
Demographics Similar to Indians (Asian) by College, 1 year or more
In terms of college, 1 year or more, the demographic groups most similar to Indians (Asian) are Latvian (66.1%, a difference of 0.040%), Immigrants from Ireland (65.9%, a difference of 0.24%), Immigrants from Belgium (66.3%, a difference of 0.35%), Immigrants from France (65.8%, a difference of 0.41%), and Immigrants from China (66.4%, a difference of 0.43%).
| Demographics | Rating | Rank | College, 1 year or more |
| Eastern Europeans | 100.0 /100 | #18 | Exceptional 66.6% |
| Immigrants | Switzerland | 100.0 /100 | #19 | Exceptional 66.5% |
| Immigrants | Korea | 100.0 /100 | #20 | Exceptional 66.5% |
| Immigrants | Hong Kong | 100.0 /100 | #21 | Exceptional 66.4% |
| Soviet Union | 100.0 /100 | #22 | Exceptional 66.4% |
| Immigrants | China | 100.0 /100 | #23 | Exceptional 66.4% |
| Immigrants | Belgium | 100.0 /100 | #24 | Exceptional 66.3% |
| Indians (Asian) | 100.0 /100 | #25 | Exceptional 66.1% |
| Latvians | 100.0 /100 | #26 | Exceptional 66.1% |
| Immigrants | Ireland | 100.0 /100 | #27 | Exceptional 65.9% |
| Immigrants | France | 100.0 /100 | #28 | Exceptional 65.8% |
| Immigrants | Northern Europe | 100.0 /100 | #29 | Exceptional 65.6% |
| Immigrants | Denmark | 100.0 /100 | #30 | Exceptional 65.6% |
| Turks | 100.0 /100 | #31 | Exceptional 65.5% |
| Bulgarians | 100.0 /100 | #32 | Exceptional 65.5% |