Sioux vs Australian GED/Equivalency
COMPARE
Sioux
Australian
GED/Equivalency
GED/Equivalency Comparison
Sioux
Australians
82.6%
GED/EQUIVALENCY
0.1/ 100
METRIC RATING
281st/ 347
METRIC RANK
88.1%
GED/EQUIVALENCY
99.5/ 100
METRIC RATING
49th/ 347
METRIC RANK
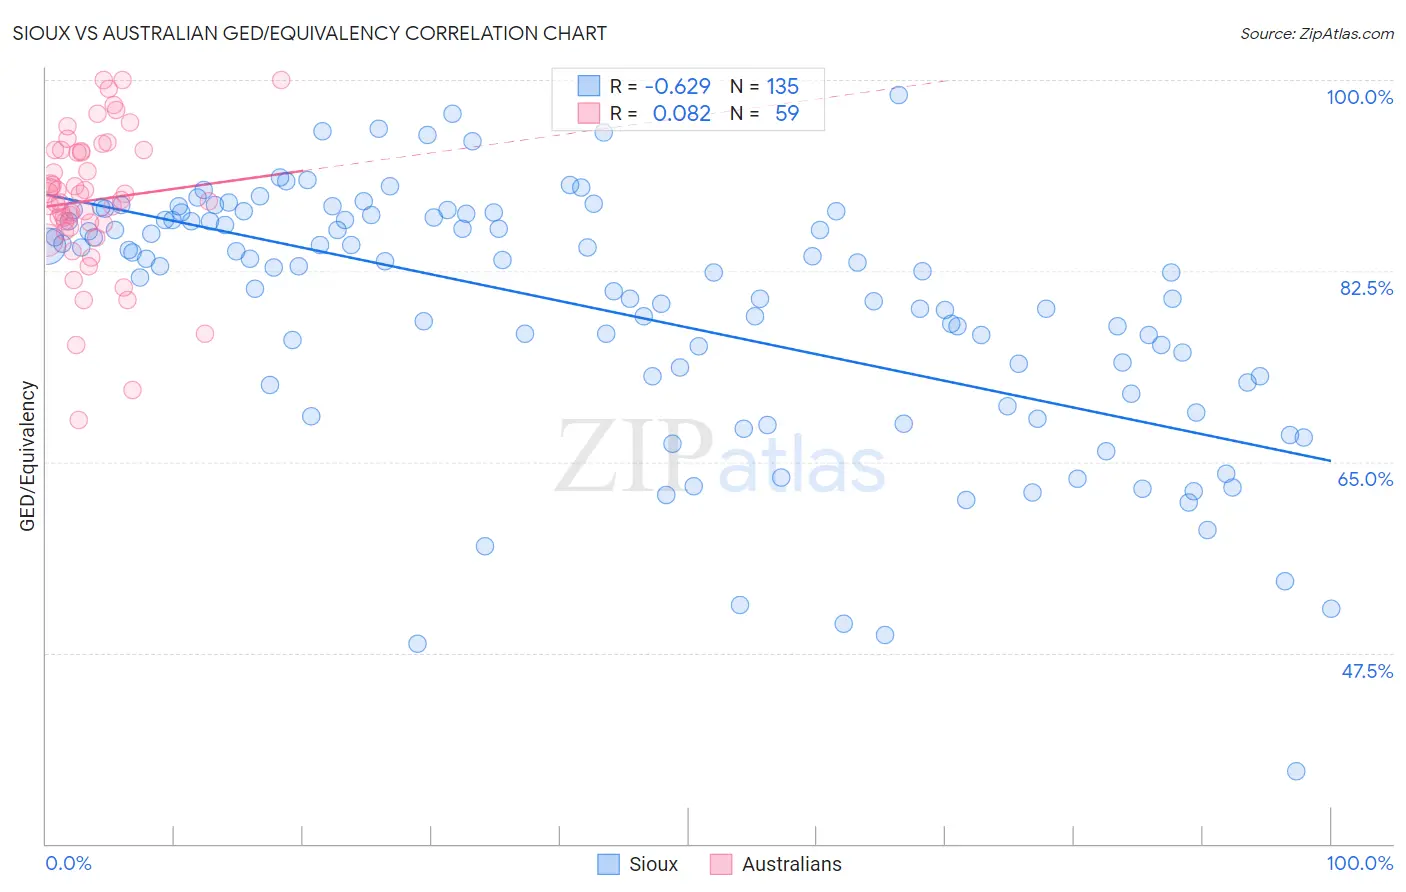
Sioux vs Australian GED/Equivalency Correlation Chart
The statistical analysis conducted on geographies consisting of 234,200,345 people shows a significant negative correlation between the proportion of Sioux and percentage of population with at least ged/equivalency education in the United States with a correlation coefficient (R) of -0.629 and weighted average of 82.6%. Similarly, the statistical analysis conducted on geographies consisting of 224,163,773 people shows a slight positive correlation between the proportion of Australians and percentage of population with at least ged/equivalency education in the United States with a correlation coefficient (R) of 0.082 and weighted average of 88.1%, a difference of 6.6%.
GED/Equivalency Correlation Summary
| Measurement | Sioux | Australian |
| Minimum | 36.6% | 68.9% |
| Maximum | 98.6% | 100.0% |
| Range | 62.0% | 31.1% |
| Mean | 78.9% | 89.0% |
| Median | 82.8% | 89.0% |
| Interquartile 25% (IQ1) | 72.3% | 86.5% |
| Interquartile 75% (IQ3) | 87.4% | 93.6% |
| Interquartile Range (IQR) | 15.2% | 7.0% |
| Standard Deviation (Sample) | 11.7% | 6.5% |
| Standard Deviation (Population) | 11.6% | 6.5% |
Similar Demographics by GED/Equivalency
Demographics Similar to Sioux by GED/Equivalency
In terms of ged/equivalency, the demographic groups most similar to Sioux are Immigrants from Fiji (82.7%, a difference of 0.090%), Cheyenne (82.7%, a difference of 0.090%), Immigrants (82.6%, a difference of 0.090%), Immigrants from Laos (82.7%, a difference of 0.10%), and Arapaho (82.8%, a difference of 0.14%).
| Demographics | Rating | Rank | GED/Equivalency |
| Immigrants | Trinidad and Tobago | 0.1 /100 | #274 | Tragic 82.8% |
| Seminole | 0.1 /100 | #275 | Tragic 82.8% |
| Blacks/African Americans | 0.1 /100 | #276 | Tragic 82.8% |
| Arapaho | 0.1 /100 | #277 | Tragic 82.8% |
| Immigrants | Laos | 0.1 /100 | #278 | Tragic 82.7% |
| Immigrants | Fiji | 0.1 /100 | #279 | Tragic 82.7% |
| Cheyenne | 0.1 /100 | #280 | Tragic 82.7% |
| Sioux | 0.1 /100 | #281 | Tragic 82.6% |
| Immigrants | Immigrants | 0.1 /100 | #282 | Tragic 82.6% |
| Indonesians | 0.1 /100 | #283 | Tragic 82.5% |
| Immigrants | Barbados | 0.1 /100 | #284 | Tragic 82.4% |
| Cajuns | 0.0 /100 | #285 | Tragic 82.4% |
| Immigrants | West Indies | 0.0 /100 | #286 | Tragic 82.4% |
| Japanese | 0.0 /100 | #287 | Tragic 82.4% |
| Pueblo | 0.0 /100 | #288 | Tragic 82.3% |
Demographics Similar to Australians by GED/Equivalency
In terms of ged/equivalency, the demographic groups most similar to Australians are Greek (88.1%, a difference of 0.010%), Immigrants from Korea (88.1%, a difference of 0.010%), Immigrants from Latvia (88.1%, a difference of 0.020%), Immigrants from Switzerland (88.1%, a difference of 0.030%), and Czech (88.1%, a difference of 0.040%).
| Demographics | Rating | Rank | GED/Equivalency |
| Cambodians | 99.6 /100 | #42 | Exceptional 88.2% |
| Immigrants | Scotland | 99.6 /100 | #43 | Exceptional 88.2% |
| Macedonians | 99.5 /100 | #44 | Exceptional 88.1% |
| Czechs | 99.5 /100 | #45 | Exceptional 88.1% |
| Immigrants | Switzerland | 99.5 /100 | #46 | Exceptional 88.1% |
| Immigrants | Latvia | 99.5 /100 | #47 | Exceptional 88.1% |
| Greeks | 99.5 /100 | #48 | Exceptional 88.1% |
| Australians | 99.5 /100 | #49 | Exceptional 88.1% |
| Immigrants | Korea | 99.5 /100 | #50 | Exceptional 88.1% |
| Immigrants | Netherlands | 99.4 /100 | #51 | Exceptional 88.0% |
| Zimbabweans | 99.4 /100 | #52 | Exceptional 88.0% |
| Immigrants | South Africa | 99.4 /100 | #53 | Exceptional 88.0% |
| Soviet Union | 99.4 /100 | #54 | Exceptional 88.0% |
| New Zealanders | 99.4 /100 | #55 | Exceptional 88.0% |
| Immigrants | Denmark | 99.4 /100 | #56 | Exceptional 88.0% |