Sioux vs Alsatian GED/Equivalency
COMPARE
Sioux
Alsatian
GED/Equivalency
GED/Equivalency Comparison
Sioux
Alsatians
82.6%
GED/EQUIVALENCY
0.1/ 100
METRIC RATING
281st/ 347
METRIC RANK
86.0%
GED/EQUIVALENCY
64.3/ 100
METRIC RATING
165th/ 347
METRIC RANK
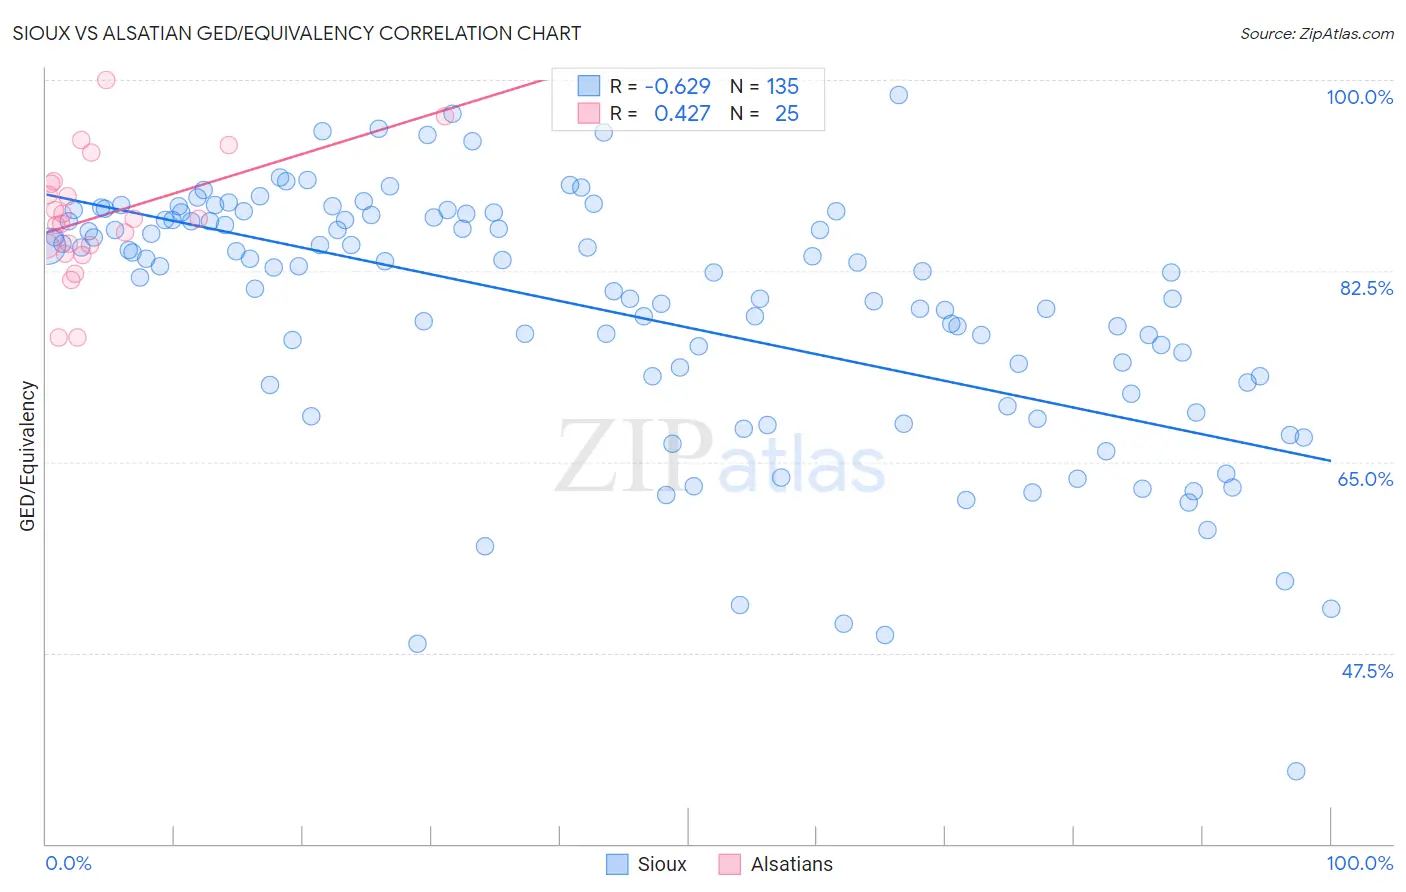
Sioux vs Alsatian GED/Equivalency Correlation Chart
The statistical analysis conducted on geographies consisting of 234,200,345 people shows a significant negative correlation between the proportion of Sioux and percentage of population with at least ged/equivalency education in the United States with a correlation coefficient (R) of -0.629 and weighted average of 82.6%. Similarly, the statistical analysis conducted on geographies consisting of 82,682,365 people shows a moderate positive correlation between the proportion of Alsatians and percentage of population with at least ged/equivalency education in the United States with a correlation coefficient (R) of 0.427 and weighted average of 86.0%, a difference of 4.1%.
GED/Equivalency Correlation Summary
| Measurement | Sioux | Alsatian |
| Minimum | 36.6% | 76.4% |
| Maximum | 98.6% | 100.0% |
| Range | 62.0% | 23.6% |
| Mean | 78.9% | 87.5% |
| Median | 82.8% | 87.3% |
| Interquartile 25% (IQ1) | 72.3% | 84.5% |
| Interquartile 75% (IQ3) | 87.4% | 90.6% |
| Interquartile Range (IQR) | 15.2% | 6.2% |
| Standard Deviation (Sample) | 11.7% | 5.6% |
| Standard Deviation (Population) | 11.6% | 5.5% |
Similar Demographics by GED/Equivalency
Demographics Similar to Sioux by GED/Equivalency
In terms of ged/equivalency, the demographic groups most similar to Sioux are Immigrants from Fiji (82.7%, a difference of 0.090%), Cheyenne (82.7%, a difference of 0.090%), Immigrants (82.6%, a difference of 0.090%), Immigrants from Laos (82.7%, a difference of 0.10%), and Arapaho (82.8%, a difference of 0.14%).
| Demographics | Rating | Rank | GED/Equivalency |
| Immigrants | Trinidad and Tobago | 0.1 /100 | #274 | Tragic 82.8% |
| Seminole | 0.1 /100 | #275 | Tragic 82.8% |
| Blacks/African Americans | 0.1 /100 | #276 | Tragic 82.8% |
| Arapaho | 0.1 /100 | #277 | Tragic 82.8% |
| Immigrants | Laos | 0.1 /100 | #278 | Tragic 82.7% |
| Immigrants | Fiji | 0.1 /100 | #279 | Tragic 82.7% |
| Cheyenne | 0.1 /100 | #280 | Tragic 82.7% |
| Sioux | 0.1 /100 | #281 | Tragic 82.6% |
| Immigrants | Immigrants | 0.1 /100 | #282 | Tragic 82.6% |
| Indonesians | 0.1 /100 | #283 | Tragic 82.5% |
| Immigrants | Barbados | 0.1 /100 | #284 | Tragic 82.4% |
| Cajuns | 0.0 /100 | #285 | Tragic 82.4% |
| Immigrants | West Indies | 0.0 /100 | #286 | Tragic 82.4% |
| Japanese | 0.0 /100 | #287 | Tragic 82.4% |
| Pueblo | 0.0 /100 | #288 | Tragic 82.3% |
Demographics Similar to Alsatians by GED/Equivalency
In terms of ged/equivalency, the demographic groups most similar to Alsatians are Immigrants from Albania (86.0%, a difference of 0.0%), Ethiopian (86.0%, a difference of 0.010%), Venezuelan (86.0%, a difference of 0.030%), Ugandan (86.1%, a difference of 0.040%), and Sierra Leonean (86.0%, a difference of 0.050%).
| Demographics | Rating | Rank | GED/Equivalency |
| German Russians | 72.1 /100 | #158 | Good 86.2% |
| Immigrants | Kenya | 71.8 /100 | #159 | Good 86.2% |
| Immigrants | Morocco | 69.5 /100 | #160 | Good 86.1% |
| Immigrants | Syria | 69.3 /100 | #161 | Good 86.1% |
| Immigrants | Iraq | 68.1 /100 | #162 | Good 86.1% |
| Ugandans | 66.3 /100 | #163 | Good 86.1% |
| Venezuelans | 65.5 /100 | #164 | Good 86.0% |
| Alsatians | 64.3 /100 | #165 | Good 86.0% |
| Immigrants | Albania | 64.2 /100 | #166 | Good 86.0% |
| Ethiopians | 63.7 /100 | #167 | Good 86.0% |
| Sierra Leoneans | 61.8 /100 | #168 | Good 86.0% |
| Immigrants | Ethiopia | 61.2 /100 | #169 | Good 86.0% |
| Afghans | 59.7 /100 | #170 | Average 85.9% |
| Immigrants | Chile | 57.3 /100 | #171 | Average 85.9% |
| Bermudans | 55.1 /100 | #172 | Average 85.8% |