Czechoslovakian vs Seminole College, 1 year or more
COMPARE
Czechoslovakian
Seminole
College, 1 year or more
College, 1 year or more Comparison
Czechoslovakians
Seminole
59.4%
COLLEGE, 1 YEAR OR MORE
48.3/ 100
METRIC RATING
178th/ 347
METRIC RANK
52.1%
COLLEGE, 1 YEAR OR MORE
0.0/ 100
METRIC RATING
305th/ 347
METRIC RANK
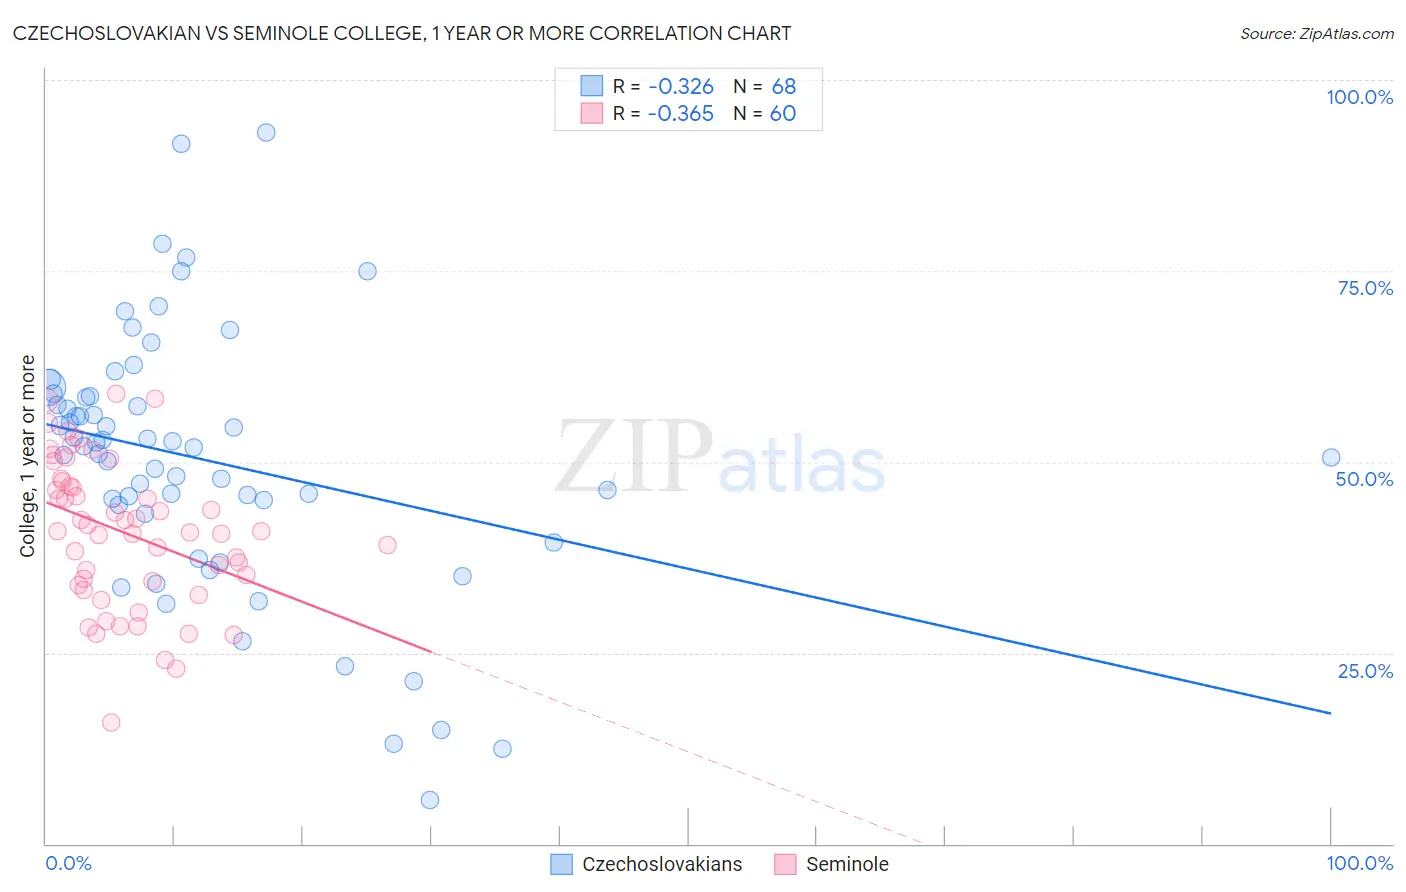
Czechoslovakian vs Seminole College, 1 year or more Correlation Chart
The statistical analysis conducted on geographies consisting of 368,667,186 people shows a mild negative correlation between the proportion of Czechoslovakians and percentage of population with at least college, 1 year or more education in the United States with a correlation coefficient (R) of -0.326 and weighted average of 59.4%. Similarly, the statistical analysis conducted on geographies consisting of 118,314,121 people shows a mild negative correlation between the proportion of Seminole and percentage of population with at least college, 1 year or more education in the United States with a correlation coefficient (R) of -0.365 and weighted average of 52.1%, a difference of 14.0%.
College, 1 year or more Correlation Summary
| Measurement | Czechoslovakian | Seminole |
| Minimum | 5.7% | 15.9% |
| Maximum | 93.1% | 59.0% |
| Range | 87.4% | 43.1% |
| Mean | 50.2% | 40.7% |
| Median | 52.0% | 41.0% |
| Interquartile 25% (IQ1) | 43.7% | 34.1% |
| Interquartile 75% (IQ3) | 58.5% | 47.2% |
| Interquartile Range (IQR) | 14.7% | 13.1% |
| Standard Deviation (Sample) | 17.1% | 9.6% |
| Standard Deviation (Population) | 16.9% | 9.5% |
Similar Demographics by College, 1 year or more
Demographics Similar to Czechoslovakians by College, 1 year or more
In terms of college, 1 year or more, the demographic groups most similar to Czechoslovakians are Tlingit-Haida (59.4%, a difference of 0.0%), Immigrants from Poland (59.4%, a difference of 0.030%), Sri Lankan (59.4%, a difference of 0.040%), Celtic (59.4%, a difference of 0.090%), and Bermudan (59.3%, a difference of 0.090%).
| Demographics | Rating | Rank | College, 1 year or more |
| Immigrants | Albania | 52.3 /100 | #171 | Average 59.5% |
| Immigrants | Sierra Leone | 52.2 /100 | #172 | Average 59.5% |
| Immigrants | Oceania | 51.2 /100 | #173 | Average 59.4% |
| Celtics | 50.0 /100 | #174 | Average 59.4% |
| Sri Lankans | 49.0 /100 | #175 | Average 59.4% |
| Immigrants | Poland | 48.9 /100 | #176 | Average 59.4% |
| Tlingit-Haida | 48.4 /100 | #177 | Average 59.4% |
| Czechoslovakians | 48.3 /100 | #178 | Average 59.4% |
| Bermudans | 46.6 /100 | #179 | Average 59.3% |
| Yugoslavians | 44.1 /100 | #180 | Average 59.2% |
| Swiss | 43.4 /100 | #181 | Average 59.2% |
| Immigrants | Bosnia and Herzegovina | 42.8 /100 | #182 | Average 59.2% |
| German Russians | 39.3 /100 | #183 | Fair 59.1% |
| Spaniards | 38.3 /100 | #184 | Fair 59.0% |
| South Americans | 35.9 /100 | #185 | Fair 59.0% |
Demographics Similar to Seminole by College, 1 year or more
In terms of college, 1 year or more, the demographic groups most similar to Seminole are Central American (52.1%, a difference of 0.10%), Creek (52.2%, a difference of 0.23%), Puerto Rican (52.2%, a difference of 0.31%), Mexican American Indian (51.9%, a difference of 0.33%), and Haitian (52.3%, a difference of 0.44%).
| Demographics | Rating | Rank | College, 1 year or more |
| Immigrants | Dominica | 0.0 /100 | #298 | Tragic 52.5% |
| Immigrants | Nicaragua | 0.0 /100 | #299 | Tragic 52.4% |
| Choctaw | 0.0 /100 | #300 | Tragic 52.3% |
| Haitians | 0.0 /100 | #301 | Tragic 52.3% |
| Puerto Ricans | 0.0 /100 | #302 | Tragic 52.2% |
| Creek | 0.0 /100 | #303 | Tragic 52.2% |
| Central Americans | 0.0 /100 | #304 | Tragic 52.1% |
| Seminole | 0.0 /100 | #305 | Tragic 52.1% |
| Mexican American Indians | 0.0 /100 | #306 | Tragic 51.9% |
| Immigrants | Portugal | 0.0 /100 | #307 | Tragic 51.9% |
| Salvadorans | 0.0 /100 | #308 | Tragic 51.8% |
| Apache | 0.0 /100 | #309 | Tragic 51.8% |
| Hondurans | 0.0 /100 | #310 | Tragic 51.6% |
| Immigrants | Haiti | 0.0 /100 | #311 | Tragic 51.5% |
| Pueblo | 0.0 /100 | #312 | Tragic 51.5% |