Immigrants from Spain vs Seminole College, 1 year or more
COMPARE
Immigrants from Spain
Seminole
College, 1 year or more
College, 1 year or more Comparison
Immigrants from Spain
Seminole
63.4%
COLLEGE, 1 YEAR OR MORE
99.4/ 100
METRIC RATING
64th/ 347
METRIC RANK
52.1%
COLLEGE, 1 YEAR OR MORE
0.0/ 100
METRIC RATING
305th/ 347
METRIC RANK
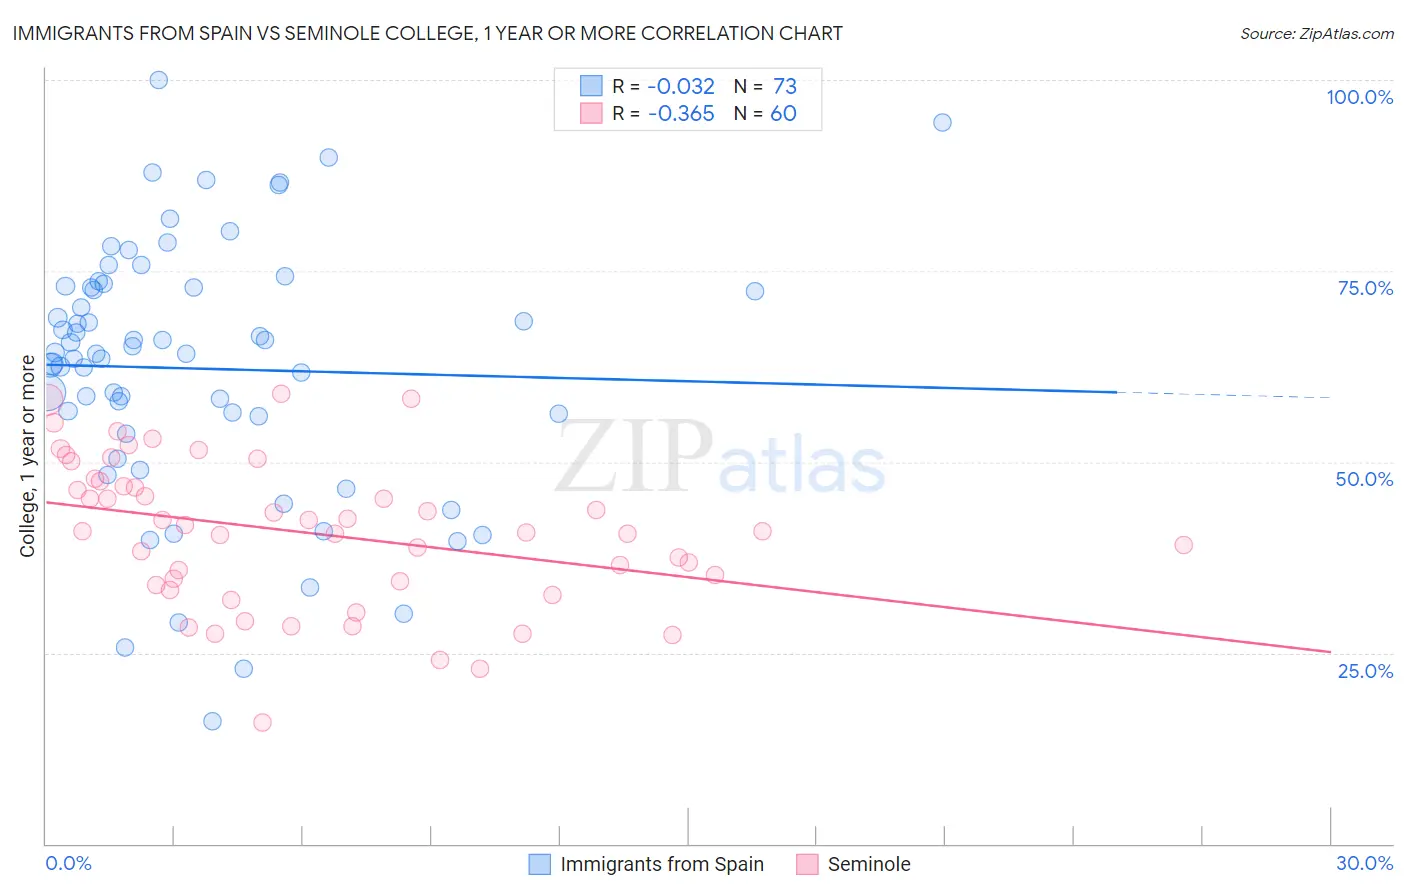
Immigrants from Spain vs Seminole College, 1 year or more Correlation Chart
The statistical analysis conducted on geographies consisting of 239,683,962 people shows no correlation between the proportion of Immigrants from Spain and percentage of population with at least college, 1 year or more education in the United States with a correlation coefficient (R) of -0.032 and weighted average of 63.4%. Similarly, the statistical analysis conducted on geographies consisting of 118,314,121 people shows a mild negative correlation between the proportion of Seminole and percentage of population with at least college, 1 year or more education in the United States with a correlation coefficient (R) of -0.365 and weighted average of 52.1%, a difference of 21.8%.
College, 1 year or more Correlation Summary
| Measurement | Immigrants from Spain | Seminole |
| Minimum | 16.1% | 15.9% |
| Maximum | 100.0% | 59.0% |
| Range | 83.9% | 43.1% |
| Mean | 62.2% | 40.7% |
| Median | 64.1% | 41.0% |
| Interquartile 25% (IQ1) | 54.8% | 34.1% |
| Interquartile 75% (IQ3) | 72.9% | 47.2% |
| Interquartile Range (IQR) | 18.1% | 13.1% |
| Standard Deviation (Sample) | 17.0% | 9.6% |
| Standard Deviation (Population) | 16.9% | 9.5% |
Similar Demographics by College, 1 year or more
Demographics Similar to Immigrants from Spain by College, 1 year or more
In terms of college, 1 year or more, the demographic groups most similar to Immigrants from Spain are Immigrants from Scotland (63.4%, a difference of 0.030%), Maltese (63.4%, a difference of 0.10%), Immigrants from Indonesia (63.5%, a difference of 0.16%), Bolivian (63.5%, a difference of 0.18%), and Immigrants from Europe (63.3%, a difference of 0.21%).
| Demographics | Rating | Rank | College, 1 year or more |
| South Africans | 99.7 /100 | #57 | Exceptional 64.1% |
| Immigrants | Asia | 99.7 /100 | #58 | Exceptional 64.0% |
| Immigrants | Serbia | 99.6 /100 | #59 | Exceptional 63.8% |
| Immigrants | Kazakhstan | 99.5 /100 | #60 | Exceptional 63.6% |
| Bolivians | 99.5 /100 | #61 | Exceptional 63.5% |
| Immigrants | Indonesia | 99.5 /100 | #62 | Exceptional 63.5% |
| Immigrants | Scotland | 99.4 /100 | #63 | Exceptional 63.4% |
| Immigrants | Spain | 99.4 /100 | #64 | Exceptional 63.4% |
| Maltese | 99.3 /100 | #65 | Exceptional 63.4% |
| Immigrants | Europe | 99.3 /100 | #66 | Exceptional 63.3% |
| Immigrants | Romania | 99.3 /100 | #67 | Exceptional 63.3% |
| Immigrants | Greece | 99.3 /100 | #68 | Exceptional 63.3% |
| Immigrants | Zimbabwe | 99.3 /100 | #69 | Exceptional 63.3% |
| Argentineans | 99.2 /100 | #70 | Exceptional 63.2% |
| Immigrants | Canada | 99.1 /100 | #71 | Exceptional 63.1% |
Demographics Similar to Seminole by College, 1 year or more
In terms of college, 1 year or more, the demographic groups most similar to Seminole are Central American (52.1%, a difference of 0.10%), Creek (52.2%, a difference of 0.23%), Puerto Rican (52.2%, a difference of 0.31%), Mexican American Indian (51.9%, a difference of 0.33%), and Haitian (52.3%, a difference of 0.44%).
| Demographics | Rating | Rank | College, 1 year or more |
| Immigrants | Dominica | 0.0 /100 | #298 | Tragic 52.5% |
| Immigrants | Nicaragua | 0.0 /100 | #299 | Tragic 52.4% |
| Choctaw | 0.0 /100 | #300 | Tragic 52.3% |
| Haitians | 0.0 /100 | #301 | Tragic 52.3% |
| Puerto Ricans | 0.0 /100 | #302 | Tragic 52.2% |
| Creek | 0.0 /100 | #303 | Tragic 52.2% |
| Central Americans | 0.0 /100 | #304 | Tragic 52.1% |
| Seminole | 0.0 /100 | #305 | Tragic 52.1% |
| Mexican American Indians | 0.0 /100 | #306 | Tragic 51.9% |
| Immigrants | Portugal | 0.0 /100 | #307 | Tragic 51.9% |
| Salvadorans | 0.0 /100 | #308 | Tragic 51.8% |
| Apache | 0.0 /100 | #309 | Tragic 51.8% |
| Hondurans | 0.0 /100 | #310 | Tragic 51.6% |
| Immigrants | Haiti | 0.0 /100 | #311 | Tragic 51.5% |
| Pueblo | 0.0 /100 | #312 | Tragic 51.5% |