Shoshone vs Immigrants from Afghanistan GED/Equivalency
COMPARE
Shoshone
Immigrants from Afghanistan
GED/Equivalency
GED/Equivalency Comparison
Shoshone
Immigrants from Afghanistan
83.7%
GED/EQUIVALENCY
1.0/ 100
METRIC RATING
250th/ 347
METRIC RANK
85.4%
GED/EQUIVALENCY
29.8/ 100
METRIC RATING
187th/ 347
METRIC RANK
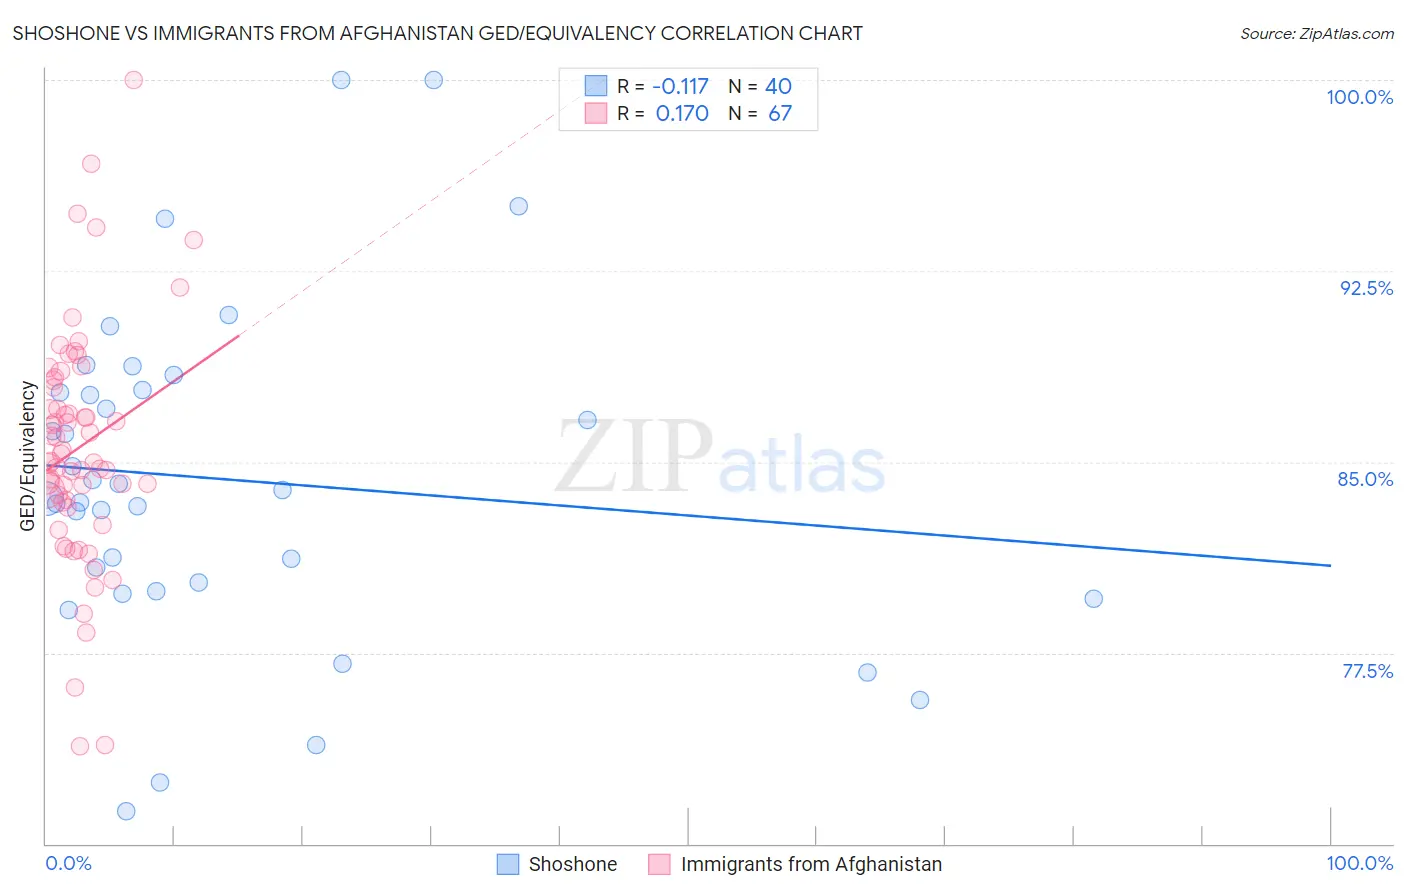
Shoshone vs Immigrants from Afghanistan GED/Equivalency Correlation Chart
The statistical analysis conducted on geographies consisting of 66,627,351 people shows a poor negative correlation between the proportion of Shoshone and percentage of population with at least ged/equivalency education in the United States with a correlation coefficient (R) of -0.117 and weighted average of 83.7%. Similarly, the statistical analysis conducted on geographies consisting of 147,629,579 people shows a poor positive correlation between the proportion of Immigrants from Afghanistan and percentage of population with at least ged/equivalency education in the United States with a correlation coefficient (R) of 0.170 and weighted average of 85.4%, a difference of 1.9%.
GED/Equivalency Correlation Summary
| Measurement | Shoshone | Immigrants from Afghanistan |
| Minimum | 71.3% | 73.8% |
| Maximum | 100.0% | 100.0% |
| Range | 28.7% | 26.2% |
| Mean | 84.3% | 85.6% |
| Median | 83.7% | 85.0% |
| Interquartile 25% (IQ1) | 80.1% | 83.4% |
| Interquartile 75% (IQ3) | 87.8% | 88.2% |
| Interquartile Range (IQR) | 7.7% | 4.8% |
| Standard Deviation (Sample) | 6.5% | 4.7% |
| Standard Deviation (Population) | 6.4% | 4.6% |
Similar Demographics by GED/Equivalency
Demographics Similar to Shoshone by GED/Equivalency
In terms of ged/equivalency, the demographic groups most similar to Shoshone are Blackfeet (83.8%, a difference of 0.020%), Crow (83.8%, a difference of 0.020%), Immigrants from Western Africa (83.8%, a difference of 0.040%), Chickasaw (83.8%, a difference of 0.070%), and Immigrants from Senegal (83.8%, a difference of 0.090%).
| Demographics | Rating | Rank | GED/Equivalency |
| Cherokee | 1.3 /100 | #243 | Tragic 83.9% |
| Immigrants | Ghana | 1.3 /100 | #244 | Tragic 83.9% |
| Immigrants | Senegal | 1.2 /100 | #245 | Tragic 83.8% |
| Chickasaw | 1.2 /100 | #246 | Tragic 83.8% |
| Immigrants | Western Africa | 1.1 /100 | #247 | Tragic 83.8% |
| Blackfeet | 1.1 /100 | #248 | Tragic 83.8% |
| Crow | 1.1 /100 | #249 | Tragic 83.8% |
| Shoshone | 1.0 /100 | #250 | Tragic 83.7% |
| Spanish Americans | 0.8 /100 | #251 | Tragic 83.6% |
| Bahamians | 0.8 /100 | #252 | Tragic 83.6% |
| Comanche | 0.7 /100 | #253 | Tragic 83.6% |
| Creek | 0.7 /100 | #254 | Tragic 83.6% |
| Colville | 0.5 /100 | #255 | Tragic 83.4% |
| Africans | 0.5 /100 | #256 | Tragic 83.4% |
| Jamaicans | 0.4 /100 | #257 | Tragic 83.3% |
Demographics Similar to Immigrants from Afghanistan by GED/Equivalency
In terms of ged/equivalency, the demographic groups most similar to Immigrants from Afghanistan are Immigrants from Sierra Leone (85.4%, a difference of 0.020%), Guamanian/Chamorro (85.3%, a difference of 0.030%), Spaniard (85.4%, a difference of 0.050%), Alaskan Athabascan (85.3%, a difference of 0.060%), and Spanish (85.4%, a difference of 0.070%).
| Demographics | Rating | Rank | GED/Equivalency |
| Immigrants | Southern Europe | 38.4 /100 | #180 | Fair 85.5% |
| Moroccans | 37.7 /100 | #181 | Fair 85.5% |
| Sudanese | 35.2 /100 | #182 | Fair 85.5% |
| Immigrants | Sudan | 34.2 /100 | #183 | Fair 85.5% |
| Immigrants | Oceania | 33.6 /100 | #184 | Fair 85.5% |
| Spanish | 32.8 /100 | #185 | Fair 85.4% |
| Spaniards | 31.9 /100 | #186 | Fair 85.4% |
| Immigrants | Afghanistan | 29.8 /100 | #187 | Fair 85.4% |
| Immigrants | Sierra Leone | 29.0 /100 | #188 | Fair 85.4% |
| Guamanians/Chamorros | 28.4 /100 | #189 | Fair 85.3% |
| Alaskan Athabascans | 27.5 /100 | #190 | Fair 85.3% |
| South American Indians | 22.8 /100 | #191 | Fair 85.2% |
| Immigrants | Nonimmigrants | 22.7 /100 | #192 | Fair 85.2% |
| Delaware | 22.2 /100 | #193 | Fair 85.2% |
| Puget Sound Salish | 20.8 /100 | #194 | Fair 85.2% |