Shoshone vs Mongolian Unemployment Among Ages 20 to 24 years
COMPARE
Shoshone
Mongolian
Unemployment Among Ages 20 to 24 years
Unemployment Among Ages 20 to 24 years Comparison
Shoshone
Mongolians
12.7%
UNEMPLOYMENT AMONG AGES 20 TO 24 YEARS
0.0/ 100
METRIC RATING
313th/ 347
METRIC RANK
9.9%
UNEMPLOYMENT AMONG AGES 20 TO 24 YEARS
99.1/ 100
METRIC RATING
68th/ 347
METRIC RANK
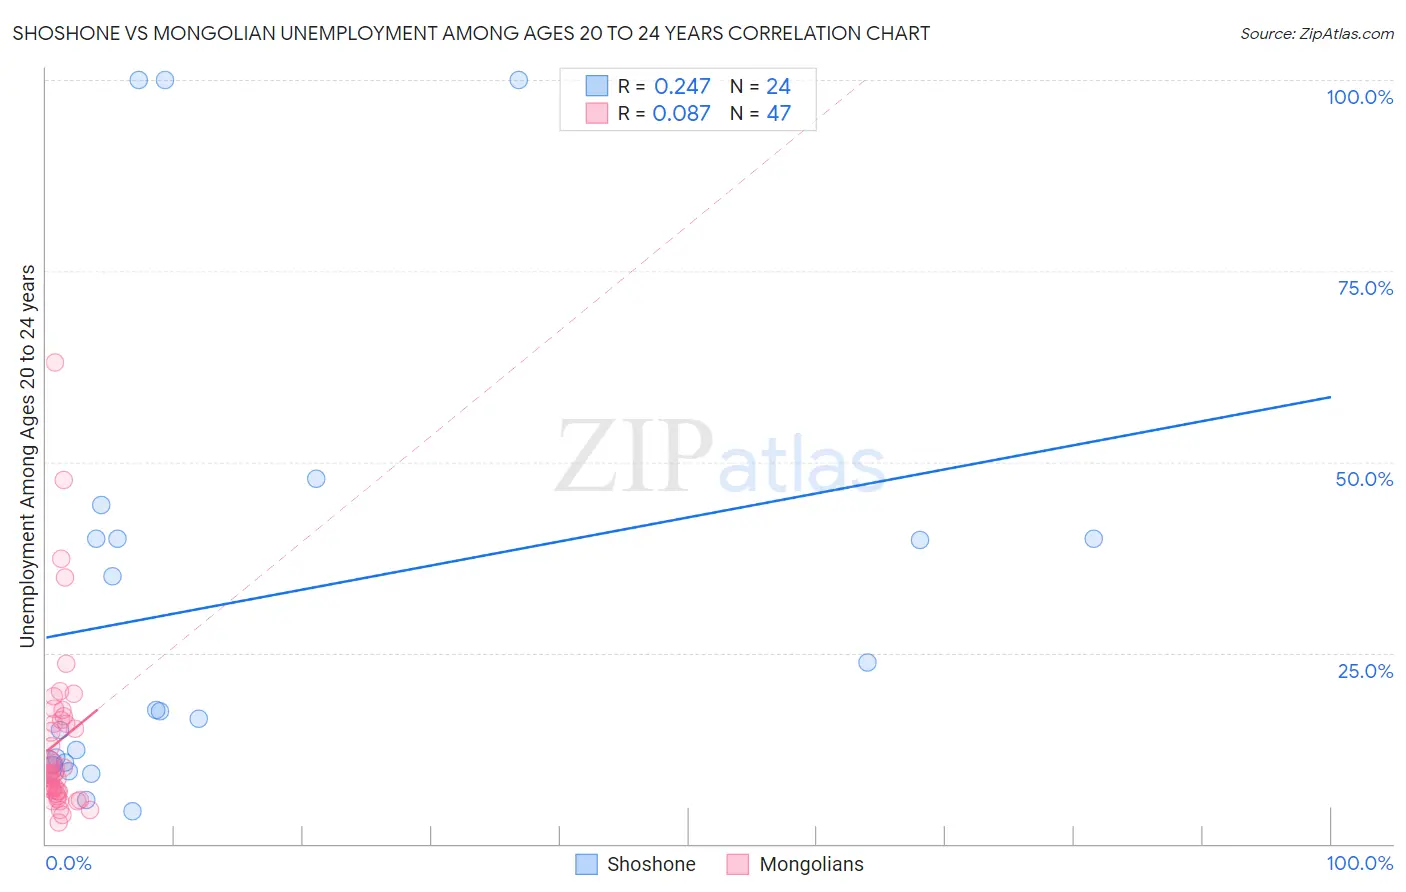
Shoshone vs Mongolian Unemployment Among Ages 20 to 24 years Correlation Chart
The statistical analysis conducted on geographies consisting of 65,930,341 people shows a weak positive correlation between the proportion of Shoshone and unemployment rate among population between the ages 20 and 24 in the United States with a correlation coefficient (R) of 0.247 and weighted average of 12.7%. Similarly, the statistical analysis conducted on geographies consisting of 139,247,610 people shows a slight positive correlation between the proportion of Mongolians and unemployment rate among population between the ages 20 and 24 in the United States with a correlation coefficient (R) of 0.087 and weighted average of 9.9%, a difference of 28.9%.
Unemployment Among Ages 20 to 24 years Correlation Summary
| Measurement | Shoshone | Mongolian |
| Minimum | 4.3% | 2.8% |
| Maximum | 100.0% | 63.0% |
| Range | 95.7% | 60.1% |
| Mean | 31.7% | 13.4% |
| Median | 17.4% | 9.2% |
| Interquartile 25% (IQ1) | 10.5% | 6.8% |
| Interquartile 75% (IQ3) | 40.0% | 16.3% |
| Interquartile Range (IQR) | 29.5% | 9.5% |
| Standard Deviation (Sample) | 29.7% | 11.6% |
| Standard Deviation (Population) | 29.1% | 11.5% |
Similar Demographics by Unemployment Among Ages 20 to 24 years
Demographics Similar to Shoshone by Unemployment Among Ages 20 to 24 years
In terms of unemployment among ages 20 to 24 years, the demographic groups most similar to Shoshone are Black/African American (12.7%, a difference of 0.19%), West Indian (12.8%, a difference of 0.40%), Houma (12.6%, a difference of 0.53%), Vietnamese (12.6%, a difference of 0.69%), and Immigrants from Dominica (12.8%, a difference of 0.88%).
| Demographics | Rating | Rank | Unemployment Among Ages 20 to 24 years |
| Immigrants | Haiti | 0.0 /100 | #306 | Tragic 12.4% |
| Bermudans | 0.0 /100 | #307 | Tragic 12.5% |
| Tohono O'odham | 0.0 /100 | #308 | Tragic 12.5% |
| Immigrants | Bangladesh | 0.0 /100 | #309 | Tragic 12.6% |
| Jamaicans | 0.0 /100 | #310 | Tragic 12.6% |
| Vietnamese | 0.0 /100 | #311 | Tragic 12.6% |
| Houma | 0.0 /100 | #312 | Tragic 12.6% |
| Shoshone | 0.0 /100 | #313 | Tragic 12.7% |
| Blacks/African Americans | 0.0 /100 | #314 | Tragic 12.7% |
| West Indians | 0.0 /100 | #315 | Tragic 12.8% |
| Immigrants | Dominica | 0.0 /100 | #316 | Tragic 12.8% |
| Immigrants | Trinidad and Tobago | 0.0 /100 | #317 | Tragic 12.8% |
| Barbadians | 0.0 /100 | #318 | Tragic 12.9% |
| Trinidadians and Tobagonians | 0.0 /100 | #319 | Tragic 12.9% |
| Cheyenne | 0.0 /100 | #320 | Tragic 13.0% |
Demographics Similar to Mongolians by Unemployment Among Ages 20 to 24 years
In terms of unemployment among ages 20 to 24 years, the demographic groups most similar to Mongolians are Immigrants from Bolivia (9.9%, a difference of 0.050%), Bulgarian (9.9%, a difference of 0.080%), Scottish (9.8%, a difference of 0.17%), Immigrants from Croatia (9.9%, a difference of 0.20%), and Celtic (9.9%, a difference of 0.23%).
| Demographics | Rating | Rank | Unemployment Among Ages 20 to 24 years |
| Malaysians | 99.5 /100 | #61 | Exceptional 9.8% |
| Immigrants | Singapore | 99.4 /100 | #62 | Exceptional 9.8% |
| British | 99.4 /100 | #63 | Exceptional 9.8% |
| Serbians | 99.4 /100 | #64 | Exceptional 9.8% |
| Welsh | 99.3 /100 | #65 | Exceptional 9.8% |
| Scottish | 99.3 /100 | #66 | Exceptional 9.8% |
| Immigrants | Bolivia | 99.2 /100 | #67 | Exceptional 9.9% |
| Mongolians | 99.1 /100 | #68 | Exceptional 9.9% |
| Bulgarians | 99.1 /100 | #69 | Exceptional 9.9% |
| Immigrants | Croatia | 99.0 /100 | #70 | Exceptional 9.9% |
| Celtics | 98.9 /100 | #71 | Exceptional 9.9% |
| Bolivians | 98.9 /100 | #72 | Exceptional 9.9% |
| Kenyans | 98.7 /100 | #73 | Exceptional 9.9% |
| Immigrants | Laos | 98.7 /100 | #74 | Exceptional 9.9% |
| Immigrants | Australia | 98.6 /100 | #75 | Exceptional 9.9% |