Shoshone vs Mongolian Kindergarten
COMPARE
Shoshone
Mongolian
Kindergarten
Kindergarten Comparison
Shoshone
Mongolians
98.3%
KINDERGARTEN
99.2/ 100
METRIC RATING
78th/ 347
METRIC RANK
97.9%
KINDERGARTEN
28.9/ 100
METRIC RATING
195th/ 347
METRIC RANK
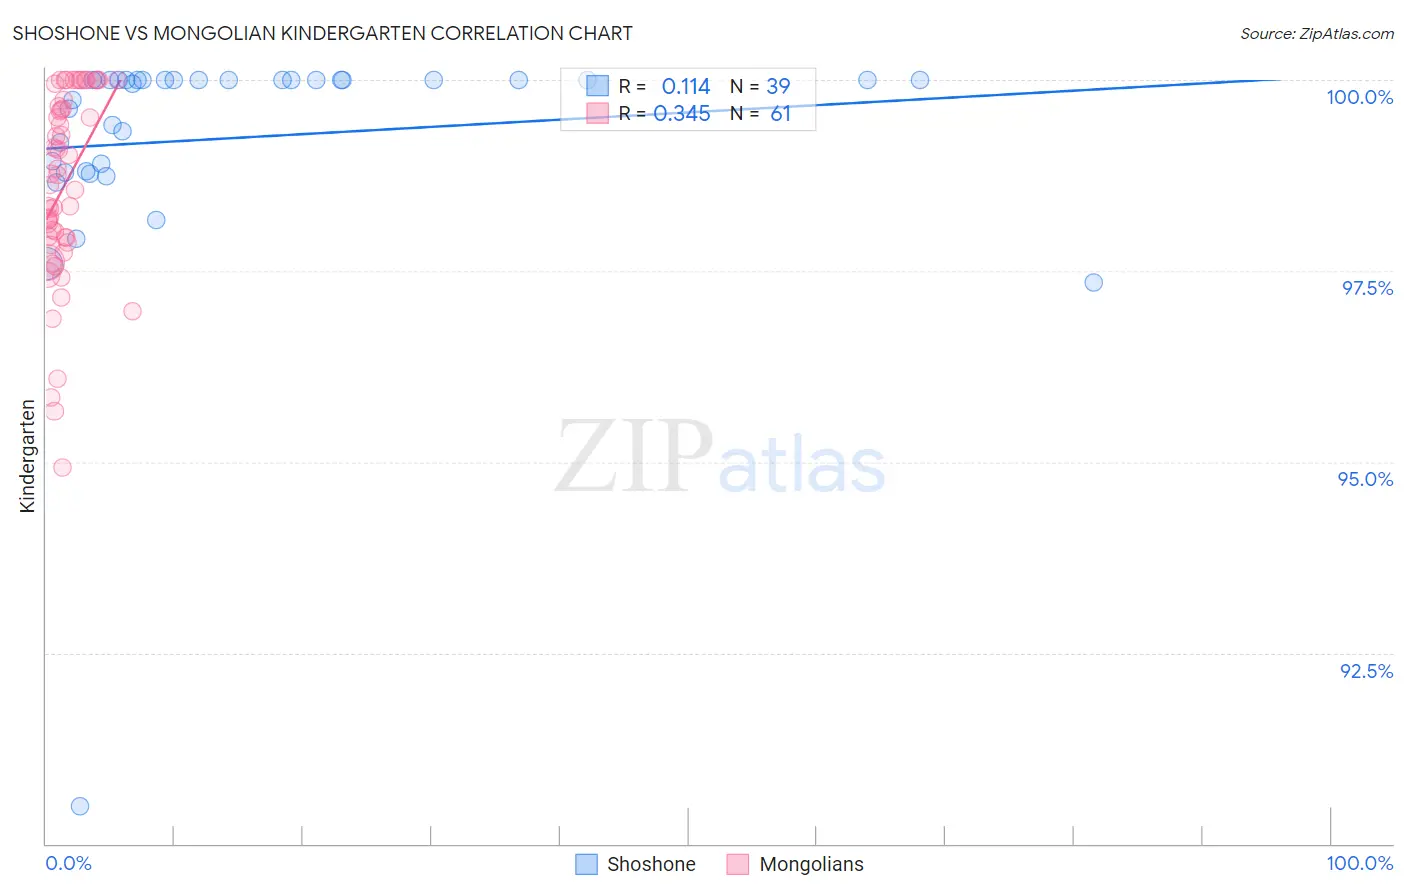
Shoshone vs Mongolian Kindergarten Correlation Chart
The statistical analysis conducted on geographies consisting of 66,625,086 people shows a poor positive correlation between the proportion of Shoshone and percentage of population with at least kindergarten education in the United States with a correlation coefficient (R) of 0.114 and weighted average of 98.3%. Similarly, the statistical analysis conducted on geographies consisting of 140,362,004 people shows a mild positive correlation between the proportion of Mongolians and percentage of population with at least kindergarten education in the United States with a correlation coefficient (R) of 0.345 and weighted average of 97.9%, a difference of 0.44%.
Kindergarten Correlation Summary
| Measurement | Shoshone | Mongolian |
| Minimum | 90.5% | 94.9% |
| Maximum | 100.0% | 100.0% |
| Range | 9.5% | 5.1% |
| Mean | 99.2% | 98.6% |
| Median | 100.0% | 98.8% |
| Interquartile 25% (IQ1) | 98.8% | 97.9% |
| Interquartile 75% (IQ3) | 100.0% | 99.7% |
| Interquartile Range (IQR) | 1.2% | 1.8% |
| Standard Deviation (Sample) | 1.6% | 1.2% |
| Standard Deviation (Population) | 1.6% | 1.2% |
Similar Demographics by Kindergarten
Demographics Similar to Shoshone by Kindergarten
In terms of kindergarten, the demographic groups most similar to Shoshone are Immigrants from England (98.3%, a difference of 0.0%), Delaware (98.3%, a difference of 0.0%), Immigrants from Belgium (98.3%, a difference of 0.0%), Immigrants from Lithuania (98.3%, a difference of 0.0%), and Icelander (98.3%, a difference of 0.0%).
| Demographics | Rating | Rank | Kindergarten |
| Chickasaw | 99.6 /100 | #71 | Exceptional 98.4% |
| Serbians | 99.6 /100 | #72 | Exceptional 98.4% |
| Cajuns | 99.4 /100 | #73 | Exceptional 98.3% |
| Immigrants | Netherlands | 99.3 /100 | #74 | Exceptional 98.3% |
| Cherokee | 99.3 /100 | #75 | Exceptional 98.3% |
| Immigrants | England | 99.3 /100 | #76 | Exceptional 98.3% |
| Delaware | 99.3 /100 | #77 | Exceptional 98.3% |
| Shoshone | 99.2 /100 | #78 | Exceptional 98.3% |
| Immigrants | Belgium | 99.2 /100 | #79 | Exceptional 98.3% |
| Immigrants | Lithuania | 99.2 /100 | #80 | Exceptional 98.3% |
| Icelanders | 99.2 /100 | #81 | Exceptional 98.3% |
| Potawatomi | 99.2 /100 | #82 | Exceptional 98.3% |
| Osage | 99.1 /100 | #83 | Exceptional 98.3% |
| Immigrants | Denmark | 99.1 /100 | #84 | Exceptional 98.3% |
| Immigrants | Sweden | 99.1 /100 | #85 | Exceptional 98.3% |
Demographics Similar to Mongolians by Kindergarten
In terms of kindergarten, the demographic groups most similar to Mongolians are Black/African American (97.9%, a difference of 0.0%), Paraguayan (97.9%, a difference of 0.0%), Hawaiian (97.9%, a difference of 0.0%), Immigrants from Taiwan (97.9%, a difference of 0.010%), and Guamanian/Chamorro (97.9%, a difference of 0.010%).
| Demographics | Rating | Rank | Kindergarten |
| Arabs | 35.4 /100 | #188 | Fair 97.9% |
| Paiute | 34.7 /100 | #189 | Fair 97.9% |
| Panamanians | 33.3 /100 | #190 | Fair 97.9% |
| Immigrants | Taiwan | 30.7 /100 | #191 | Fair 97.9% |
| Blacks/African Americans | 29.9 /100 | #192 | Fair 97.9% |
| Paraguayans | 29.6 /100 | #193 | Fair 97.9% |
| Hawaiians | 29.3 /100 | #194 | Fair 97.9% |
| Mongolians | 28.9 /100 | #195 | Fair 97.9% |
| Guamanians/Chamorros | 26.2 /100 | #196 | Fair 97.9% |
| Immigrants | Kenya | 25.5 /100 | #197 | Fair 97.9% |
| Tohono O'odham | 24.6 /100 | #198 | Fair 97.9% |
| Immigrants | Egypt | 22.3 /100 | #199 | Fair 97.9% |
| Yuman | 21.6 /100 | #200 | Fair 97.9% |
| Immigrants | Lebanon | 20.9 /100 | #201 | Fair 97.9% |
| Immigrants | Ukraine | 19.1 /100 | #202 | Poor 97.8% |