Shoshone vs Mongolian In Labor Force | Age > 16
COMPARE
Shoshone
Mongolian
In Labor Force | Age > 16
In Labor Force | Age > 16 Comparison
Shoshone
Mongolians
63.2%
IN LABOR FORCE | AGE > 16
0.0/ 100
METRIC RATING
310th/ 347
METRIC RANK
66.1%
IN LABOR FORCE | AGE > 16
99.4/ 100
METRIC RATING
85th/ 347
METRIC RANK
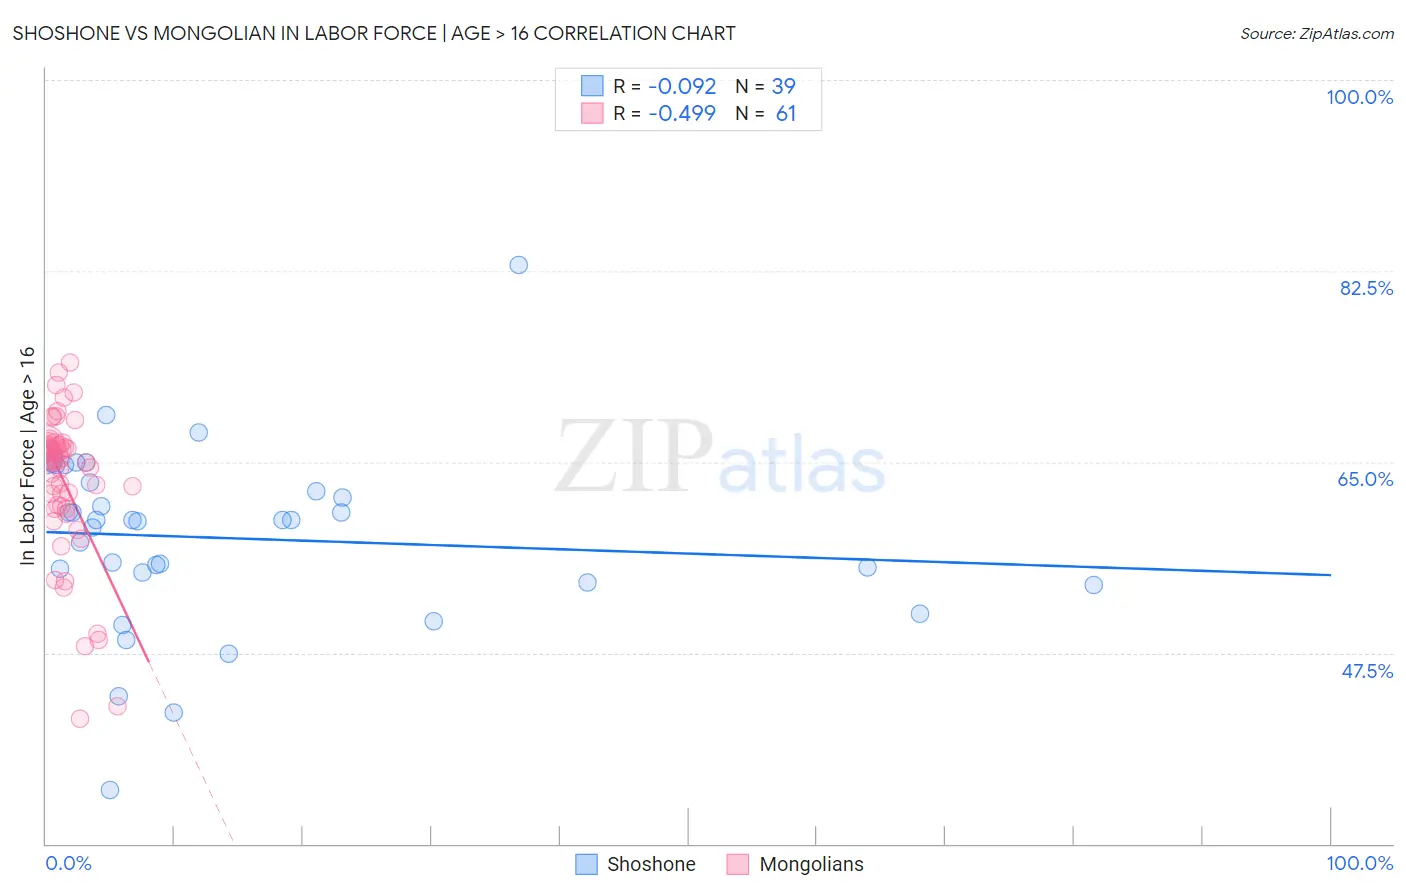
Shoshone vs Mongolian In Labor Force | Age > 16 Correlation Chart
The statistical analysis conducted on geographies consisting of 66,627,221 people shows a slight negative correlation between the proportion of Shoshone and labor force participation rate among population ages 16 and over in the United States with a correlation coefficient (R) of -0.092 and weighted average of 63.2%. Similarly, the statistical analysis conducted on geographies consisting of 140,362,004 people shows a moderate negative correlation between the proportion of Mongolians and labor force participation rate among population ages 16 and over in the United States with a correlation coefficient (R) of -0.499 and weighted average of 66.1%, a difference of 4.5%.
In Labor Force | Age > 16 Correlation Summary
| Measurement | Shoshone | Mongolian |
| Minimum | 34.9% | 41.5% |
| Maximum | 83.0% | 74.1% |
| Range | 48.1% | 32.6% |
| Mean | 58.0% | 63.1% |
| Median | 59.7% | 65.1% |
| Interquartile 25% (IQ1) | 54.0% | 60.8% |
| Interquartile 75% (IQ3) | 63.1% | 66.6% |
| Interquartile Range (IQR) | 9.1% | 5.8% |
| Standard Deviation (Sample) | 8.4% | 6.7% |
| Standard Deviation (Population) | 8.3% | 6.7% |
Similar Demographics by In Labor Force | Age > 16
Demographics Similar to Shoshone by In Labor Force | Age > 16
In terms of in labor force | age > 16, the demographic groups most similar to Shoshone are Blackfeet (63.2%, a difference of 0.010%), Scotch-Irish (63.3%, a difference of 0.070%), Iroquois (63.2%, a difference of 0.070%), Pennsylvania German (63.4%, a difference of 0.20%), and Chippewa (63.1%, a difference of 0.20%).
| Demographics | Rating | Rank | In Labor Force | Age > 16 |
| Cree | 0.0 /100 | #303 | Tragic 63.5% |
| Immigrants | Nonimmigrants | 0.0 /100 | #304 | Tragic 63.5% |
| Osage | 0.0 /100 | #305 | Tragic 63.5% |
| Blacks/African Americans | 0.0 /100 | #306 | Tragic 63.4% |
| Central American Indians | 0.0 /100 | #307 | Tragic 63.4% |
| Pennsylvania Germans | 0.0 /100 | #308 | Tragic 63.4% |
| Scotch-Irish | 0.0 /100 | #309 | Tragic 63.3% |
| Shoshone | 0.0 /100 | #310 | Tragic 63.2% |
| Blackfeet | 0.0 /100 | #311 | Tragic 63.2% |
| Iroquois | 0.0 /100 | #312 | Tragic 63.2% |
| Chippewa | 0.0 /100 | #313 | Tragic 63.1% |
| Yaqui | 0.0 /100 | #314 | Tragic 63.0% |
| Potawatomi | 0.0 /100 | #315 | Tragic 62.8% |
| Yup'ik | 0.0 /100 | #316 | Tragic 62.7% |
| Kiowa | 0.0 /100 | #317 | Tragic 62.4% |
Demographics Similar to Mongolians by In Labor Force | Age > 16
In terms of in labor force | age > 16, the demographic groups most similar to Mongolians are German Russian (66.1%, a difference of 0.020%), Immigrants from Jordan (66.1%, a difference of 0.020%), Central American (66.1%, a difference of 0.020%), South American (66.0%, a difference of 0.020%), and South American Indian (66.0%, a difference of 0.020%).
| Demographics | Rating | Rank | In Labor Force | Age > 16 |
| Immigrants | Asia | 99.6 /100 | #78 | Exceptional 66.1% |
| Turks | 99.6 /100 | #79 | Exceptional 66.1% |
| Malaysians | 99.6 /100 | #80 | Exceptional 66.1% |
| Moroccans | 99.5 /100 | #81 | Exceptional 66.1% |
| German Russians | 99.4 /100 | #82 | Exceptional 66.1% |
| Immigrants | Jordan | 99.4 /100 | #83 | Exceptional 66.1% |
| Central Americans | 99.4 /100 | #84 | Exceptional 66.1% |
| Mongolians | 99.4 /100 | #85 | Exceptional 66.1% |
| South Americans | 99.4 /100 | #86 | Exceptional 66.0% |
| South American Indians | 99.4 /100 | #87 | Exceptional 66.0% |
| Bermudans | 99.3 /100 | #88 | Exceptional 66.0% |
| Immigrants | Laos | 99.2 /100 | #89 | Exceptional 66.0% |
| Chileans | 99.2 /100 | #90 | Exceptional 66.0% |
| Iranians | 99.2 /100 | #91 | Exceptional 66.0% |
| Aleuts | 99.1 /100 | #92 | Exceptional 66.0% |