Shoshone vs Immigrants from Lithuania In Labor Force | Age 16-19
COMPARE
Shoshone
Immigrants from Lithuania
In Labor Force | Age 16-19
In Labor Force | Age 16-19 Comparison
Shoshone
Immigrants from Lithuania
39.3%
IN LABOR FORCE | AGE 16-19
99.7/ 100
METRIC RATING
81st/ 347
METRIC RANK
37.2%
IN LABOR FORCE | AGE 16-19
80.7/ 100
METRIC RATING
155th/ 347
METRIC RANK
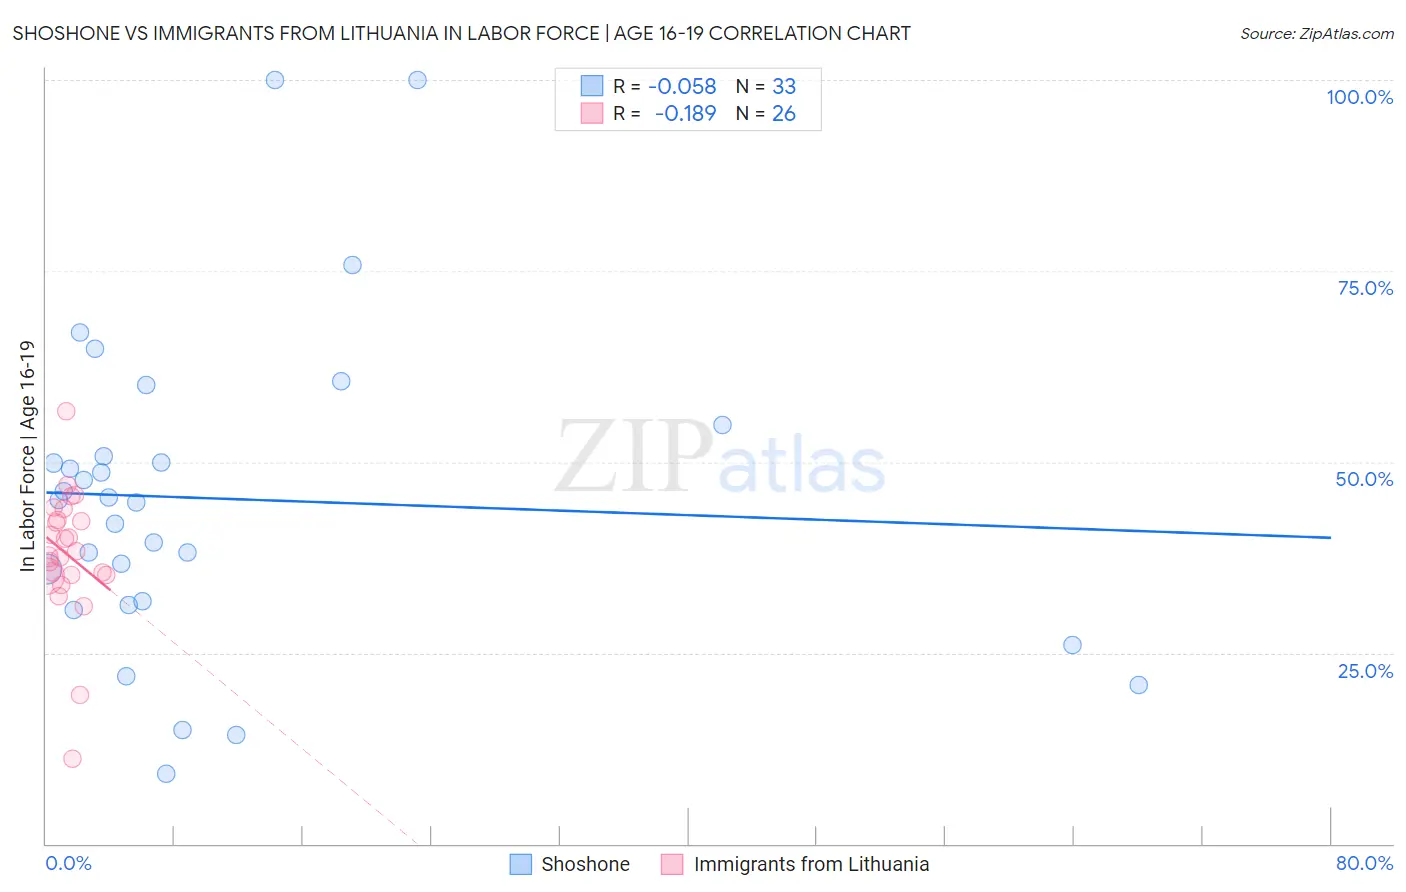
Shoshone vs Immigrants from Lithuania In Labor Force | Age 16-19 Correlation Chart
The statistical analysis conducted on geographies consisting of 66,564,469 people shows a slight negative correlation between the proportion of Shoshone and labor force participation rate among population between the ages 16 and 19 in the United States with a correlation coefficient (R) of -0.058 and weighted average of 39.3%. Similarly, the statistical analysis conducted on geographies consisting of 117,641,154 people shows a poor negative correlation between the proportion of Immigrants from Lithuania and labor force participation rate among population between the ages 16 and 19 in the United States with a correlation coefficient (R) of -0.189 and weighted average of 37.2%, a difference of 5.5%.
In Labor Force | Age 16-19 Correlation Summary
| Measurement | Shoshone | Immigrants from Lithuania |
| Minimum | 9.1% | 11.2% |
| Maximum | 100.0% | 56.7% |
| Range | 90.9% | 45.5% |
| Mean | 45.2% | 37.9% |
| Median | 45.1% | 37.9% |
| Interquartile 25% (IQ1) | 31.5% | 35.1% |
| Interquartile 75% (IQ3) | 52.7% | 42.5% |
| Interquartile Range (IQR) | 21.2% | 7.3% |
| Standard Deviation (Sample) | 20.9% | 8.7% |
| Standard Deviation (Population) | 20.6% | 8.5% |
Similar Demographics by In Labor Force | Age 16-19
Demographics Similar to Shoshone by In Labor Force | Age 16-19
In terms of in labor force | age 16-19, the demographic groups most similar to Shoshone are Basque (39.3%, a difference of 0.060%), Spanish (39.3%, a difference of 0.080%), Immigrants from Uganda (39.2%, a difference of 0.21%), Immigrants from Iraq (39.4%, a difference of 0.28%), and Creek (39.1%, a difference of 0.36%).
| Demographics | Rating | Rank | In Labor Force | Age 16-19 |
| Hungarians | 99.9 /100 | #74 | Exceptional 39.8% |
| French American Indians | 99.9 /100 | #75 | Exceptional 39.8% |
| Malaysians | 99.9 /100 | #76 | Exceptional 39.7% |
| Immigrants | Portugal | 99.9 /100 | #77 | Exceptional 39.7% |
| Austrians | 99.8 /100 | #78 | Exceptional 39.5% |
| Marshallese | 99.8 /100 | #79 | Exceptional 39.5% |
| Immigrants | Iraq | 99.8 /100 | #80 | Exceptional 39.4% |
| Shoshone | 99.7 /100 | #81 | Exceptional 39.3% |
| Basques | 99.7 /100 | #82 | Exceptional 39.3% |
| Spanish | 99.7 /100 | #83 | Exceptional 39.3% |
| Immigrants | Uganda | 99.7 /100 | #84 | Exceptional 39.2% |
| Creek | 99.6 /100 | #85 | Exceptional 39.1% |
| Samoans | 99.6 /100 | #86 | Exceptional 39.1% |
| Immigrants | Germany | 99.6 /100 | #87 | Exceptional 39.1% |
| Puget Sound Salish | 99.6 /100 | #88 | Exceptional 39.1% |
Demographics Similar to Immigrants from Lithuania by In Labor Force | Age 16-19
In terms of in labor force | age 16-19, the demographic groups most similar to Immigrants from Lithuania are Kiowa (37.2%, a difference of 0.020%), Immigrants from Bulgaria (37.3%, a difference of 0.070%), Arapaho (37.3%, a difference of 0.090%), Immigrants from Sierra Leone (37.3%, a difference of 0.25%), and Immigrants from Brazil (37.1%, a difference of 0.31%).
| Demographics | Rating | Rank | In Labor Force | Age 16-19 |
| Romanians | 87.3 /100 | #148 | Excellent 37.5% |
| Native Hawaiians | 85.0 /100 | #149 | Excellent 37.4% |
| Tsimshian | 84.7 /100 | #150 | Excellent 37.4% |
| Immigrants | Poland | 84.4 /100 | #151 | Excellent 37.3% |
| Immigrants | Sierra Leone | 83.6 /100 | #152 | Excellent 37.3% |
| Arapaho | 81.8 /100 | #153 | Excellent 37.3% |
| Immigrants | Bulgaria | 81.6 /100 | #154 | Excellent 37.3% |
| Immigrants | Lithuania | 80.7 /100 | #155 | Excellent 37.2% |
| Kiowa | 80.4 /100 | #156 | Excellent 37.2% |
| Immigrants | Brazil | 76.5 /100 | #157 | Good 37.1% |
| Ute | 75.7 /100 | #158 | Good 37.1% |
| Yaqui | 74.4 /100 | #159 | Good 37.1% |
| Immigrants | Saudi Arabia | 73.9 /100 | #160 | Good 37.0% |
| Cambodians | 71.5 /100 | #161 | Good 37.0% |
| Immigrants | Jordan | 69.5 /100 | #162 | Good 36.9% |